There are no items in your cart
Add More
Add More
| Item Details | Price | ||
|---|---|---|---|


While analyzing the broader markets, particularly the Small Cap, there appears to be a strong possibility of a decline in the coming month, potentially in the range of 7% to 12%. Let us look at the detailed analysis and understand the reasons behind this expectation.
14.08.2026
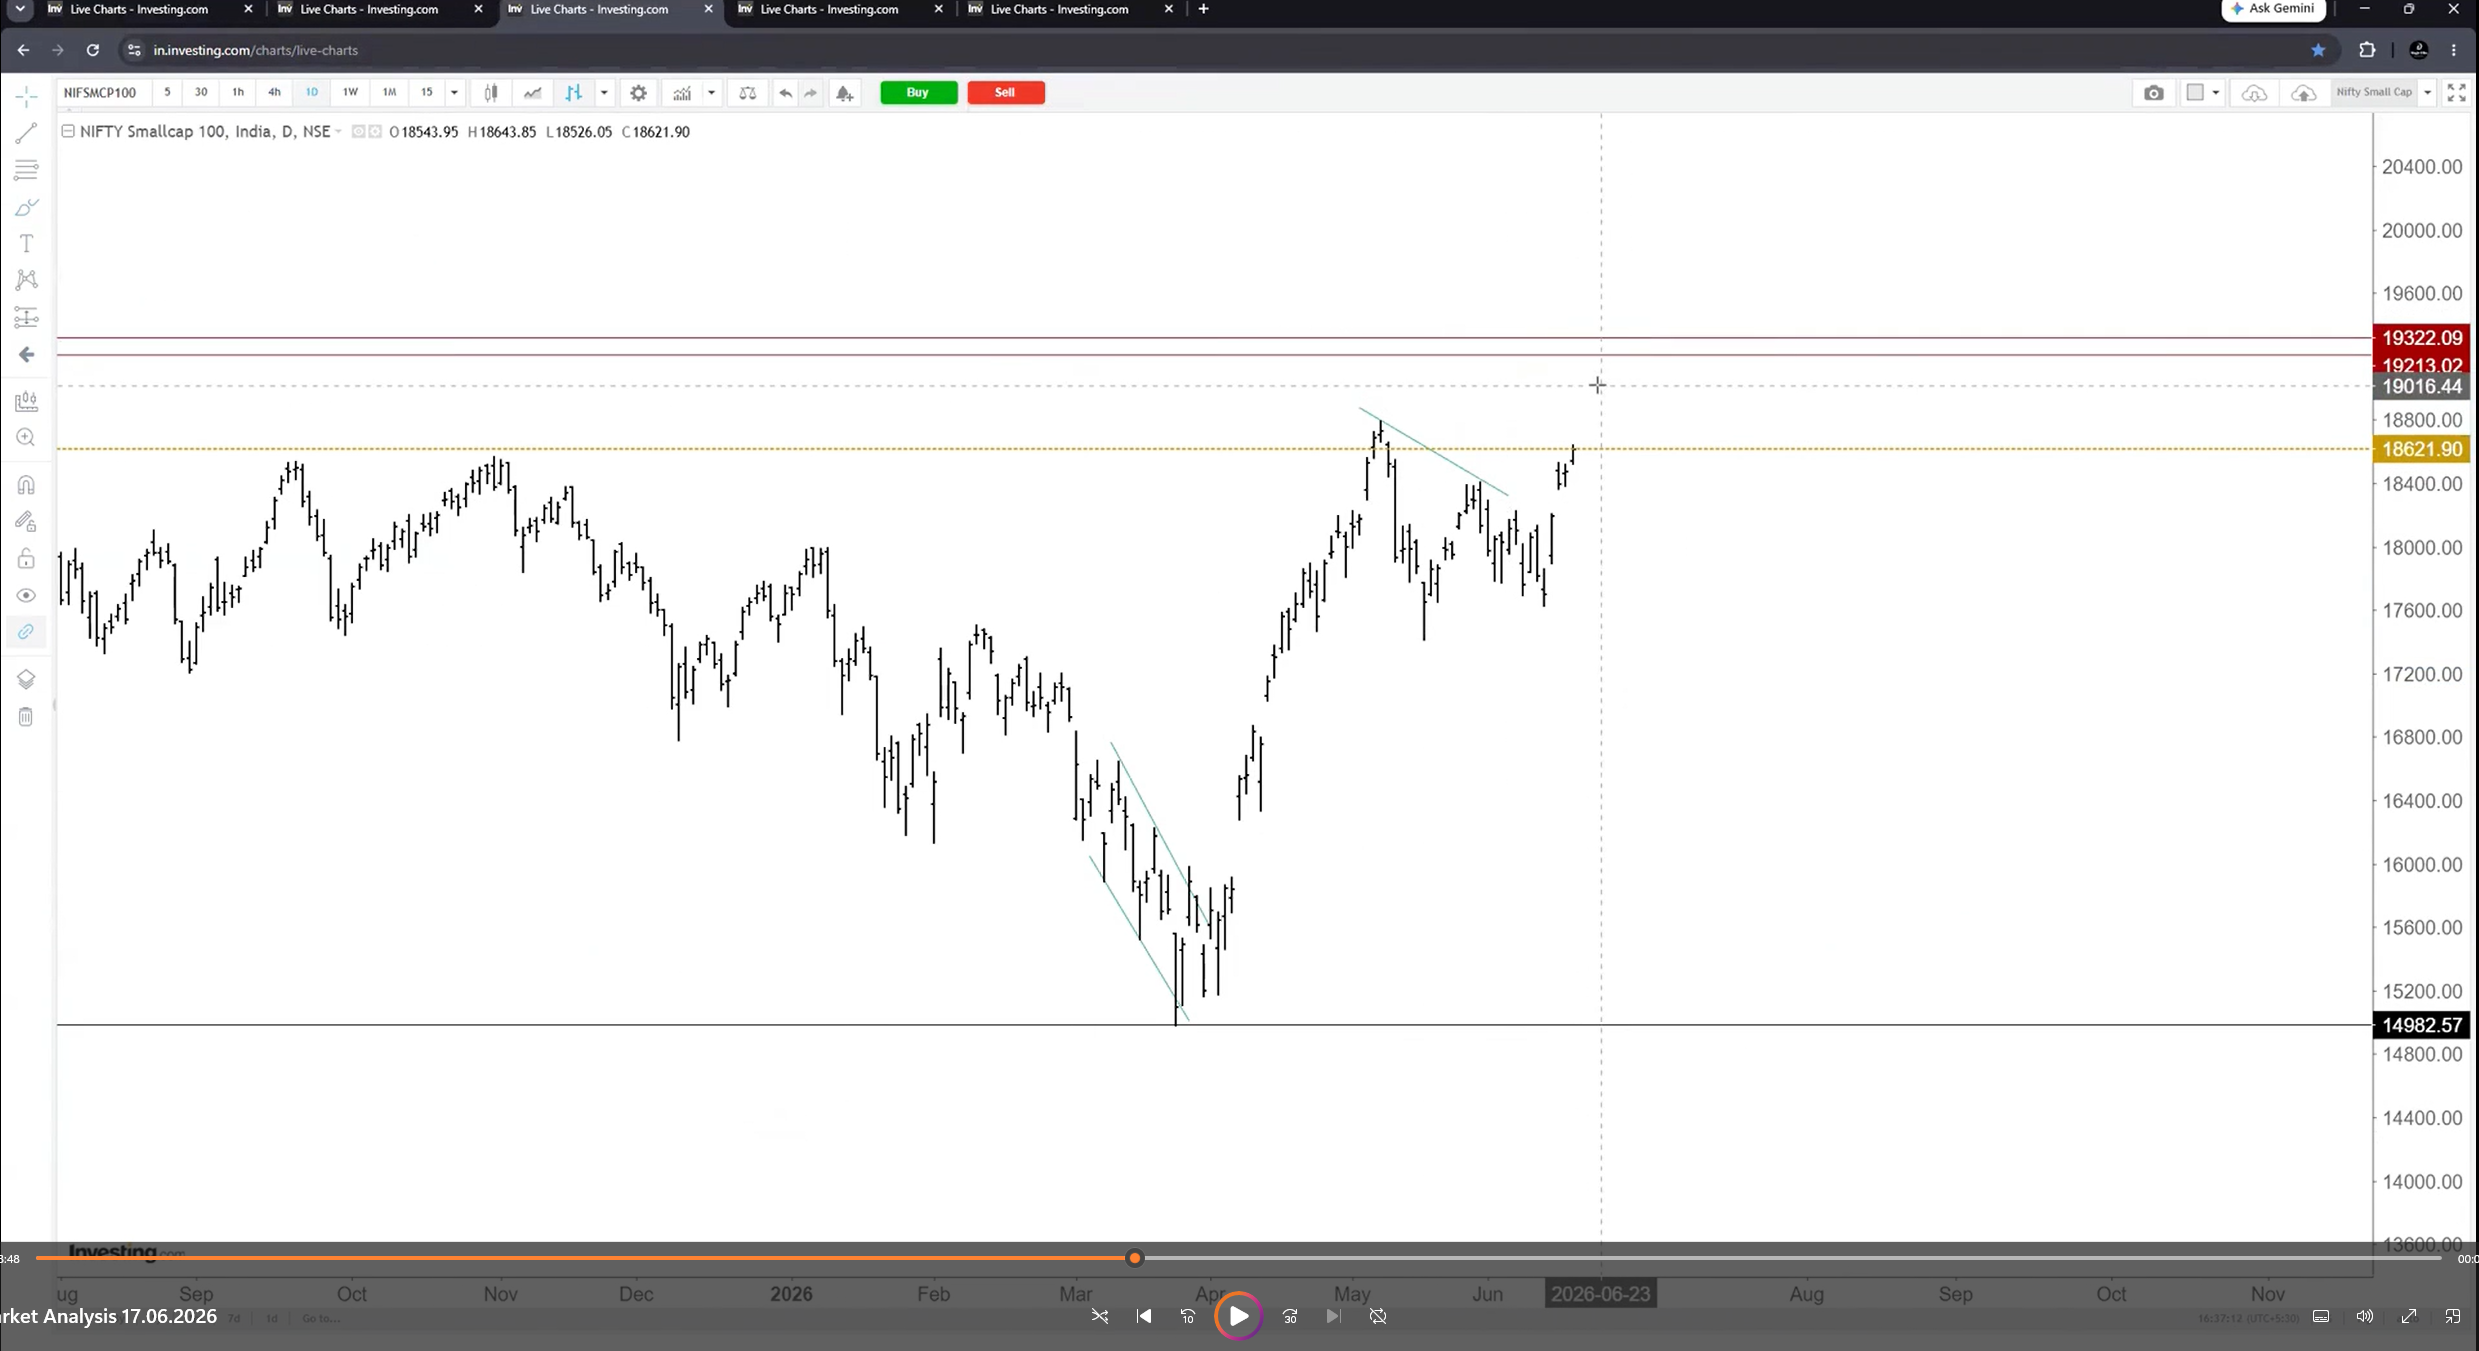
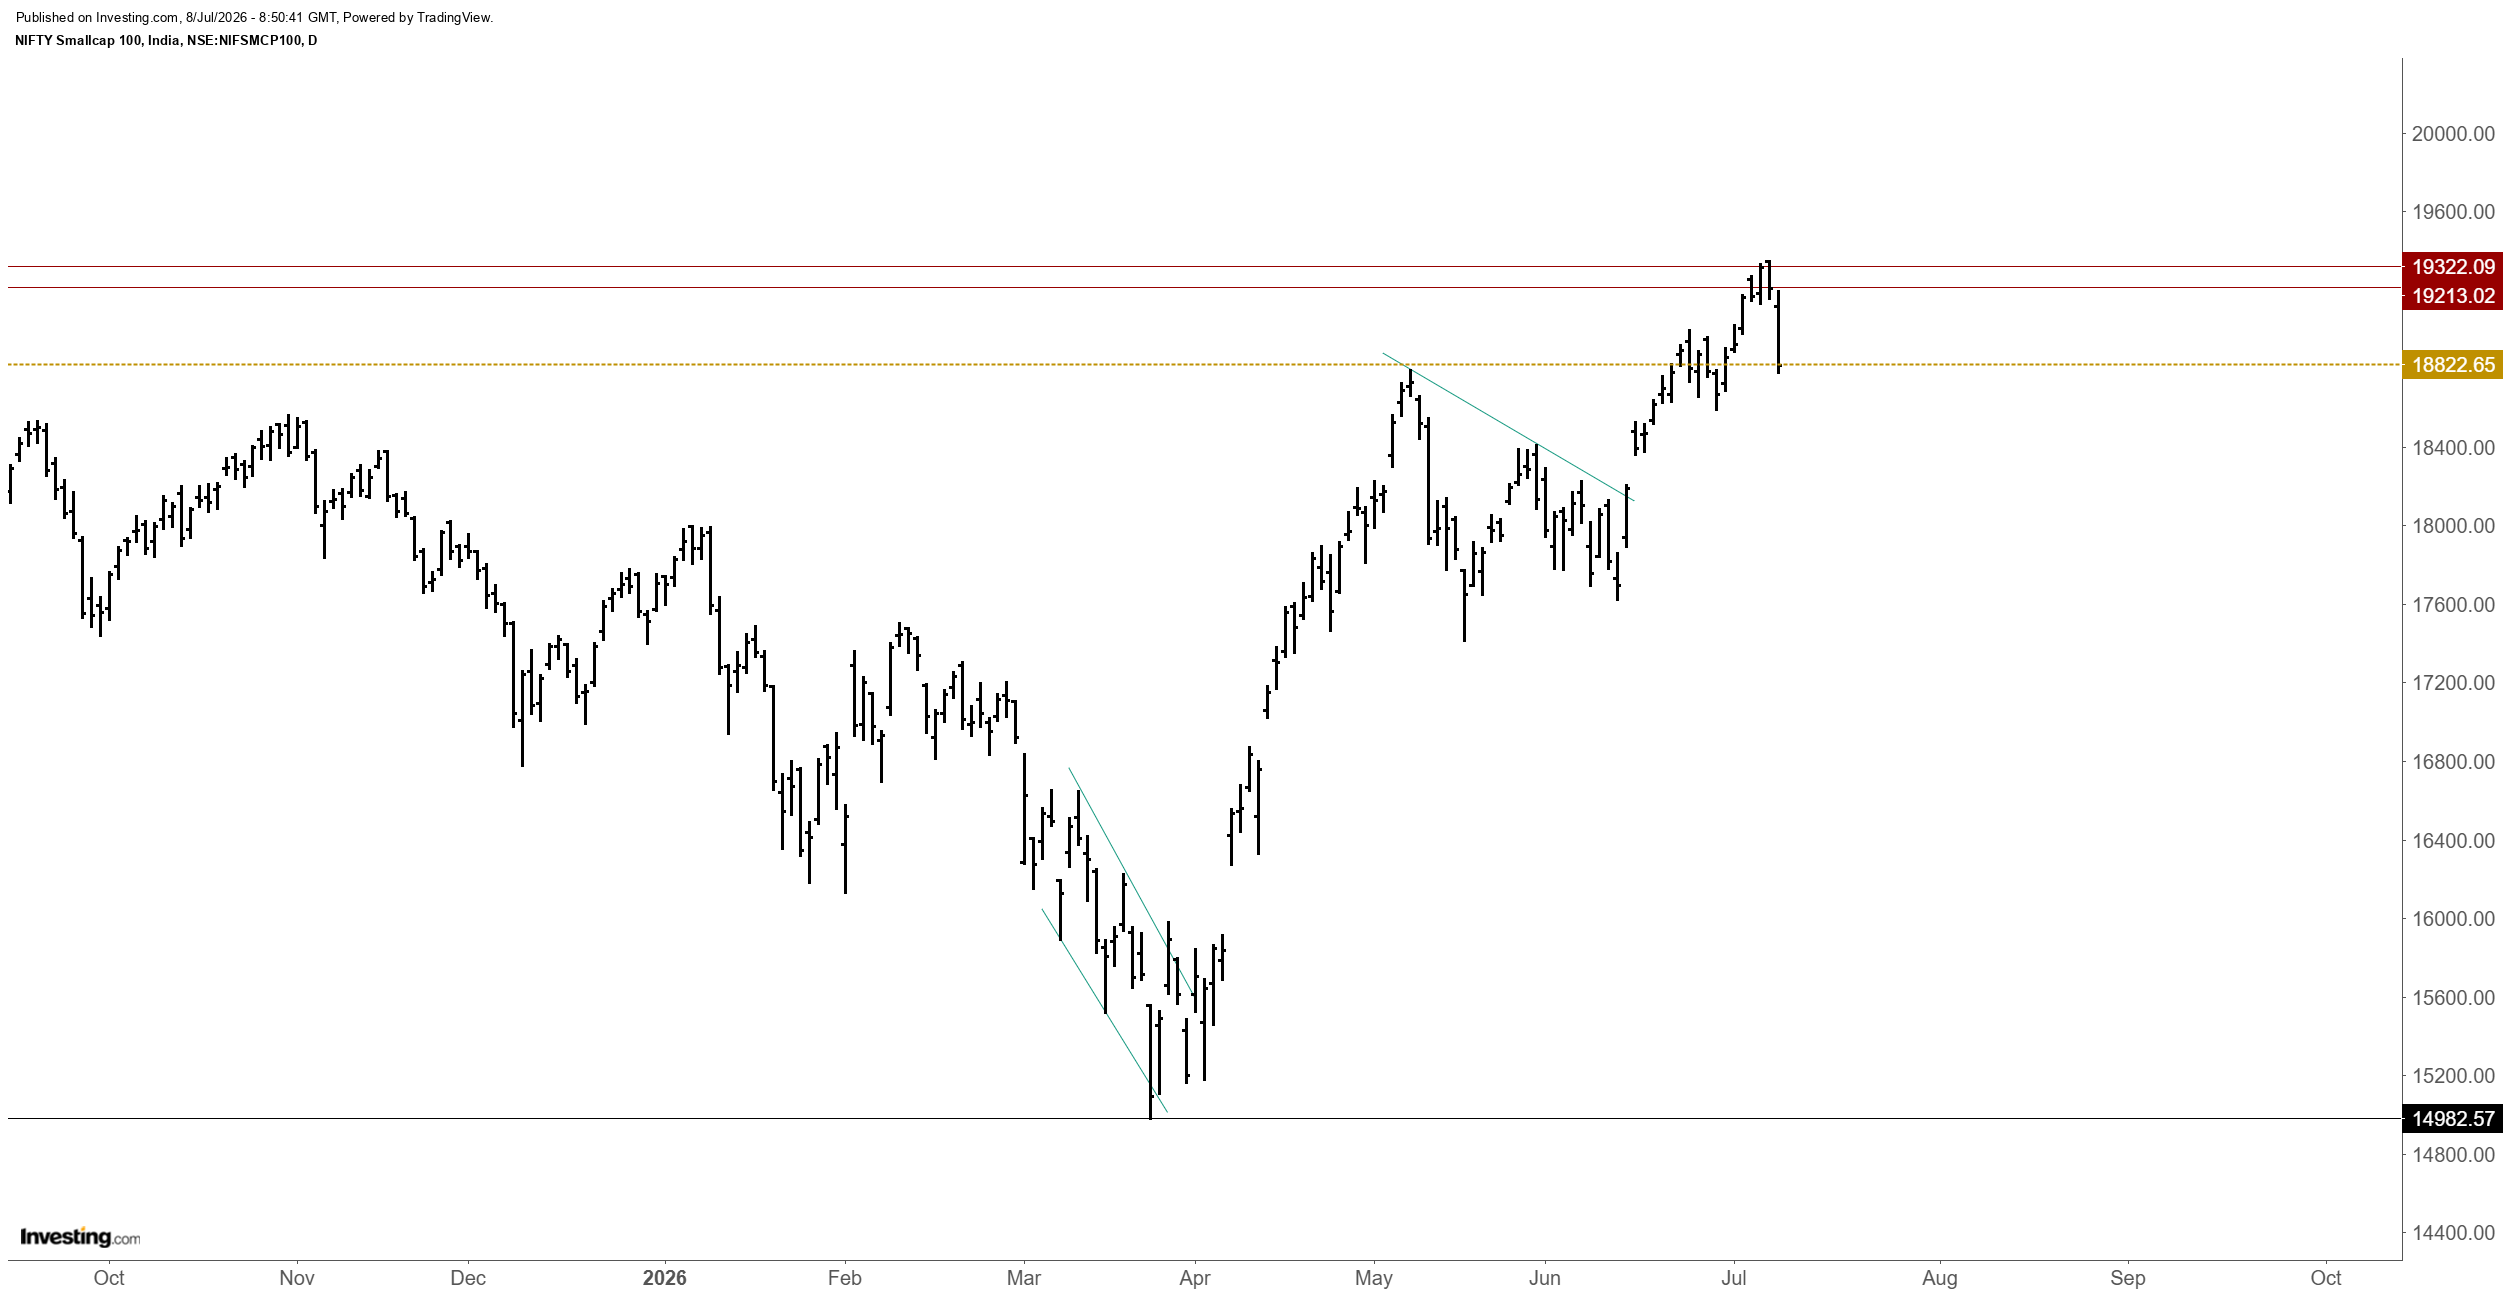
During June, we shared our analysis that the Small Cap could make its final leg higher in the ongoing uptrend that began in late March 2026. At the time, we expected the price to move toward the 19,300 zone and the index subsequently declined almost exactly from our projected resistance area.
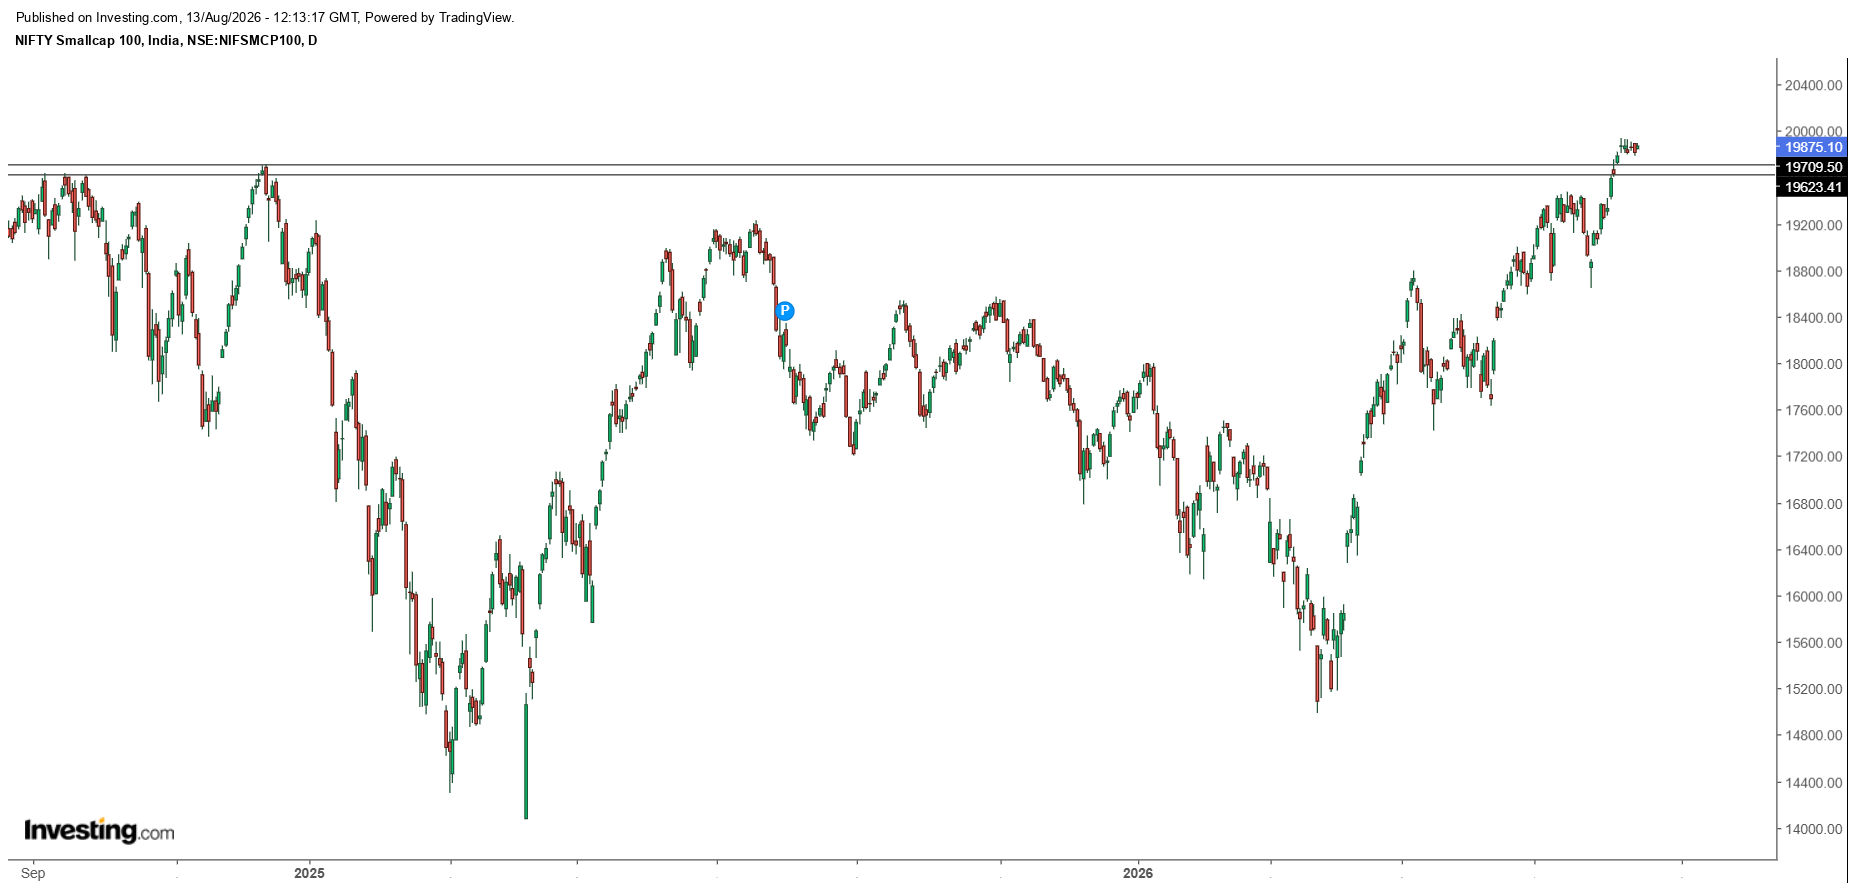
Based on the internal wave structure, we then anticipated that the Small Cap could make one more high toward the 20,000 zone. As of 13 August 2026, the index is trading at 19,875, very close to our projected target zone.
Charts showing our projection toward the 19,300 zone followed by the sharp rejection from the projected resistance area.
Why Are We Expecting a Decline?
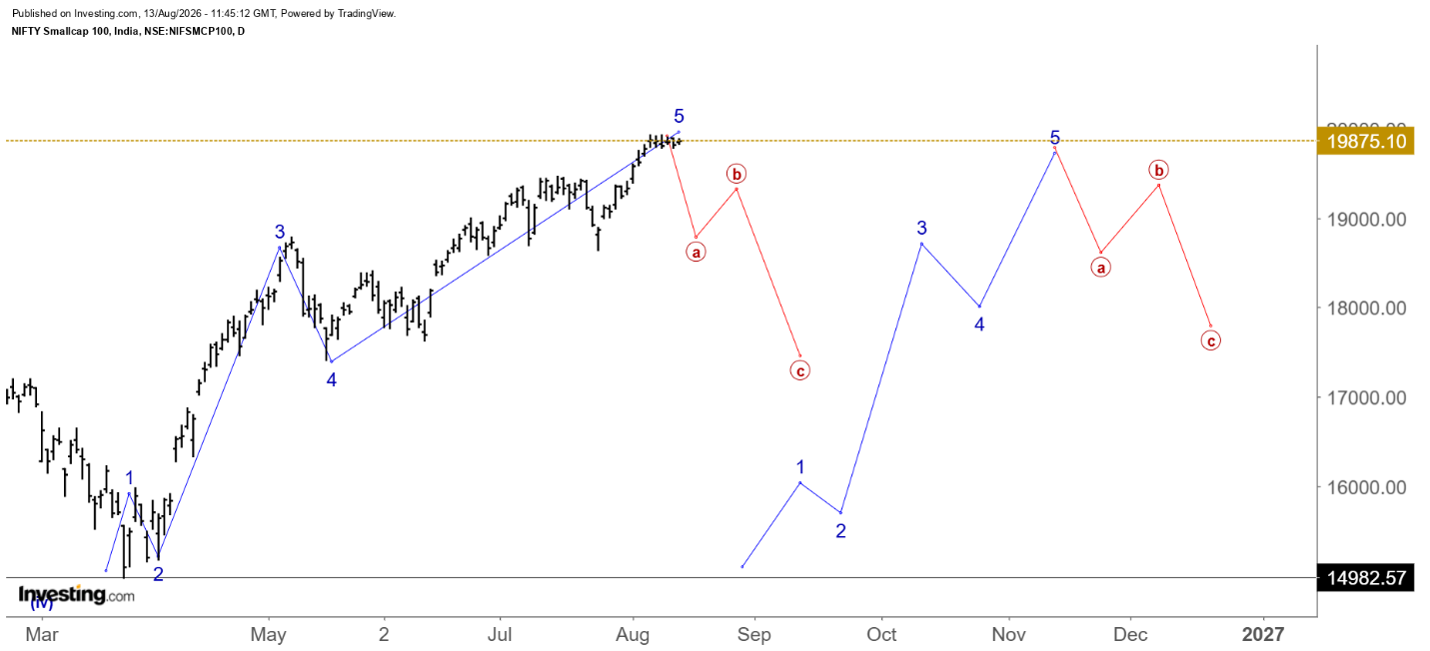
In Elliott Wave analysis, once an impulse wave is completed, the market may enter a corrective phase. Impulse waves typically develop in five waves, while corrective waves generally unfold in three waves.
In the Small Cap, the price is now very close to completing its final impulse wave, the 5th wave. If this wave completes as expected, the market could enter a corrective phase.

The chart below may help to illustrate this concept more clearly.
How Deep Could the Decline Be?
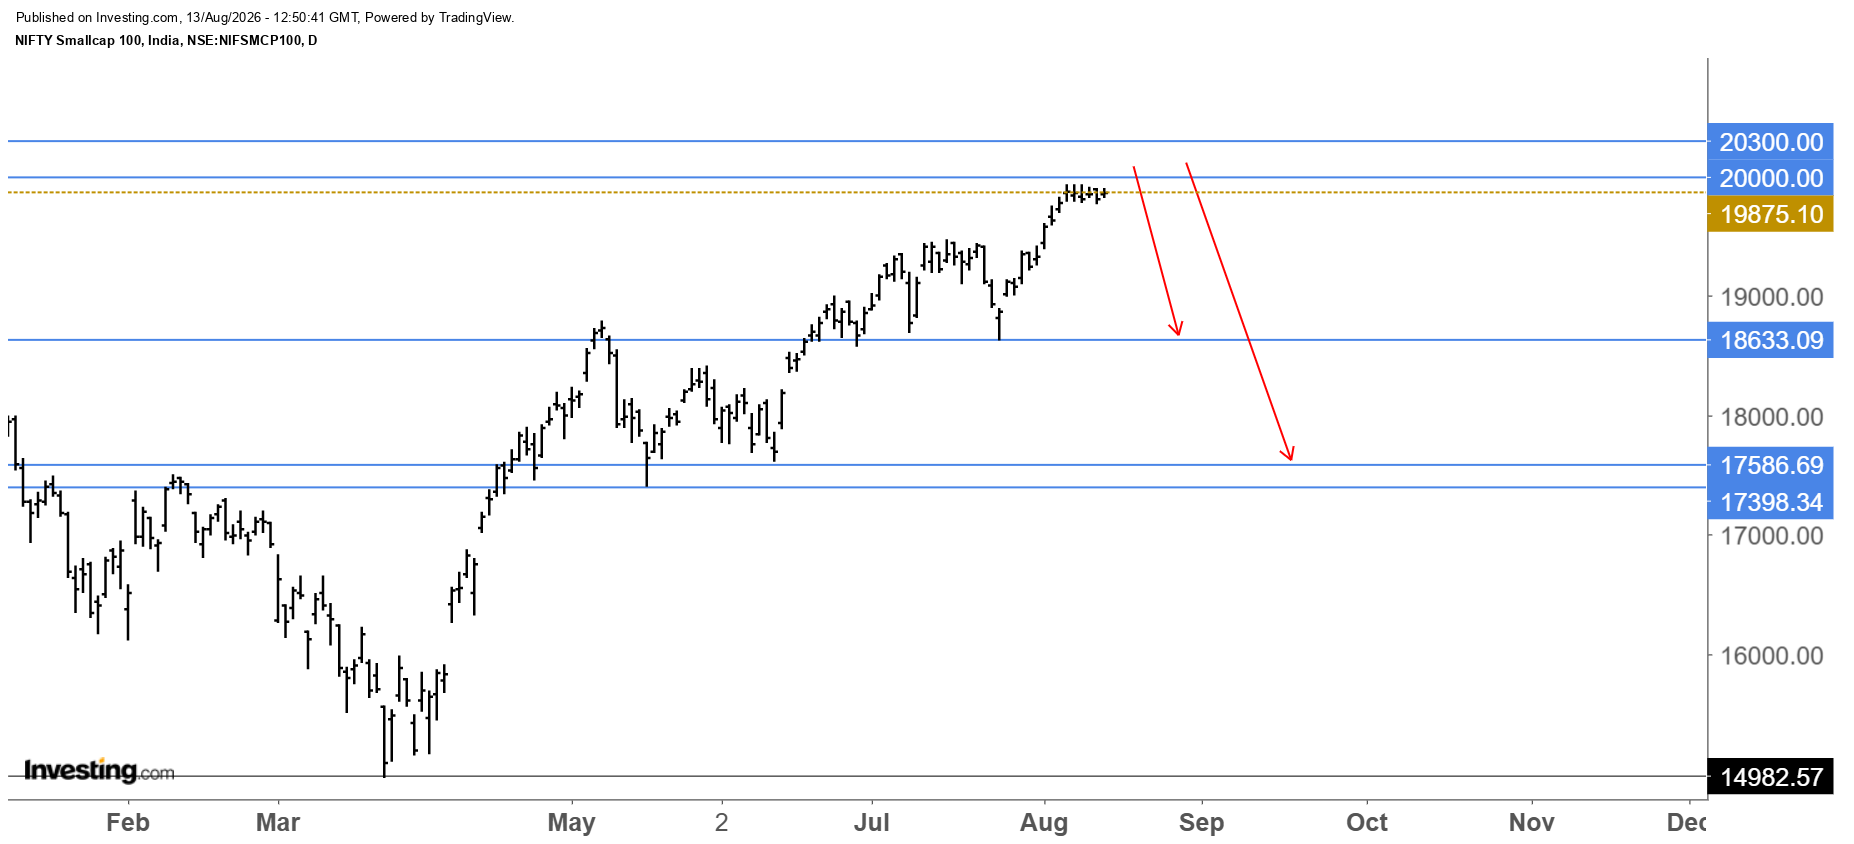
As mentioned earlier, the price is already trading close to the 20,000 resistance zone. However, there is still a possibility of one more high, which could take the Small Cap toward the 20,000–20,300 zone. In simple terms, the Small Cap is now very close to a significant resistance area.
If the correction begins from this zone, our minimum expectation is around 18,600. However, based on the wave structure, I believe the decline has the potential to extend toward 17,600. Considering 20,000 as the resistance level, a move to 18,600 would represent approximately a 7% decline, while a move to 17,600 would represent approximately a 12% decline.
What Would Negate This Corrective View?
From a technical perspective, the price has already broken out of the trendline. The chart below clearly illustrates this breakout.
If the price sustains above this breakout trendline and continues to move higher with strong momentum or price gaps, we can negate our corrective view. In such a scenario, the reason for the continued upside could be an extension of the existing wave structure
THE FINAL OPINION
According to Elliott Wave analysis, this is a zone where corrective patterns can generally develop. Based on my analysis, the Small Cap has either reached its resistance zone or may make one final high before the correction begins.
A roughly 10% decline in the Small Cap may affect not only our portfolios but also the overall market.
CRUDE Could Also Move Above $120
Crude Oil also has the potential to move above its previous high of $120. Therefore, we should observe this resistance zone with caution.
More Charts for Your Learning – Prediction of the Correction and Its Reversal in March
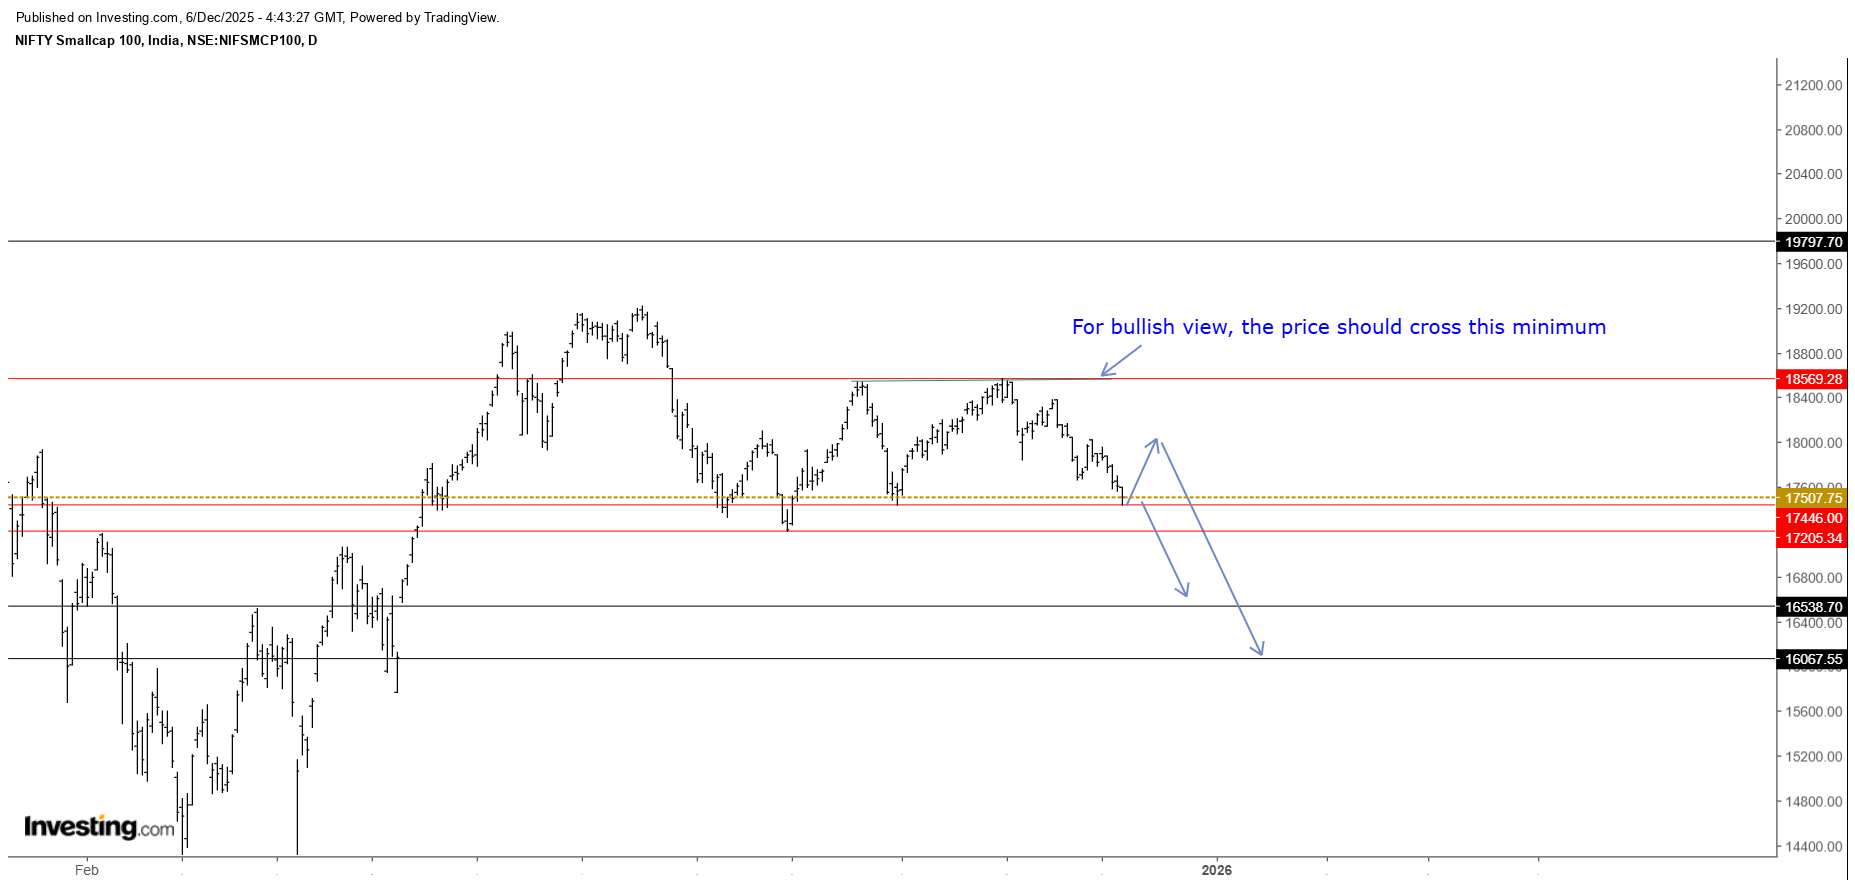
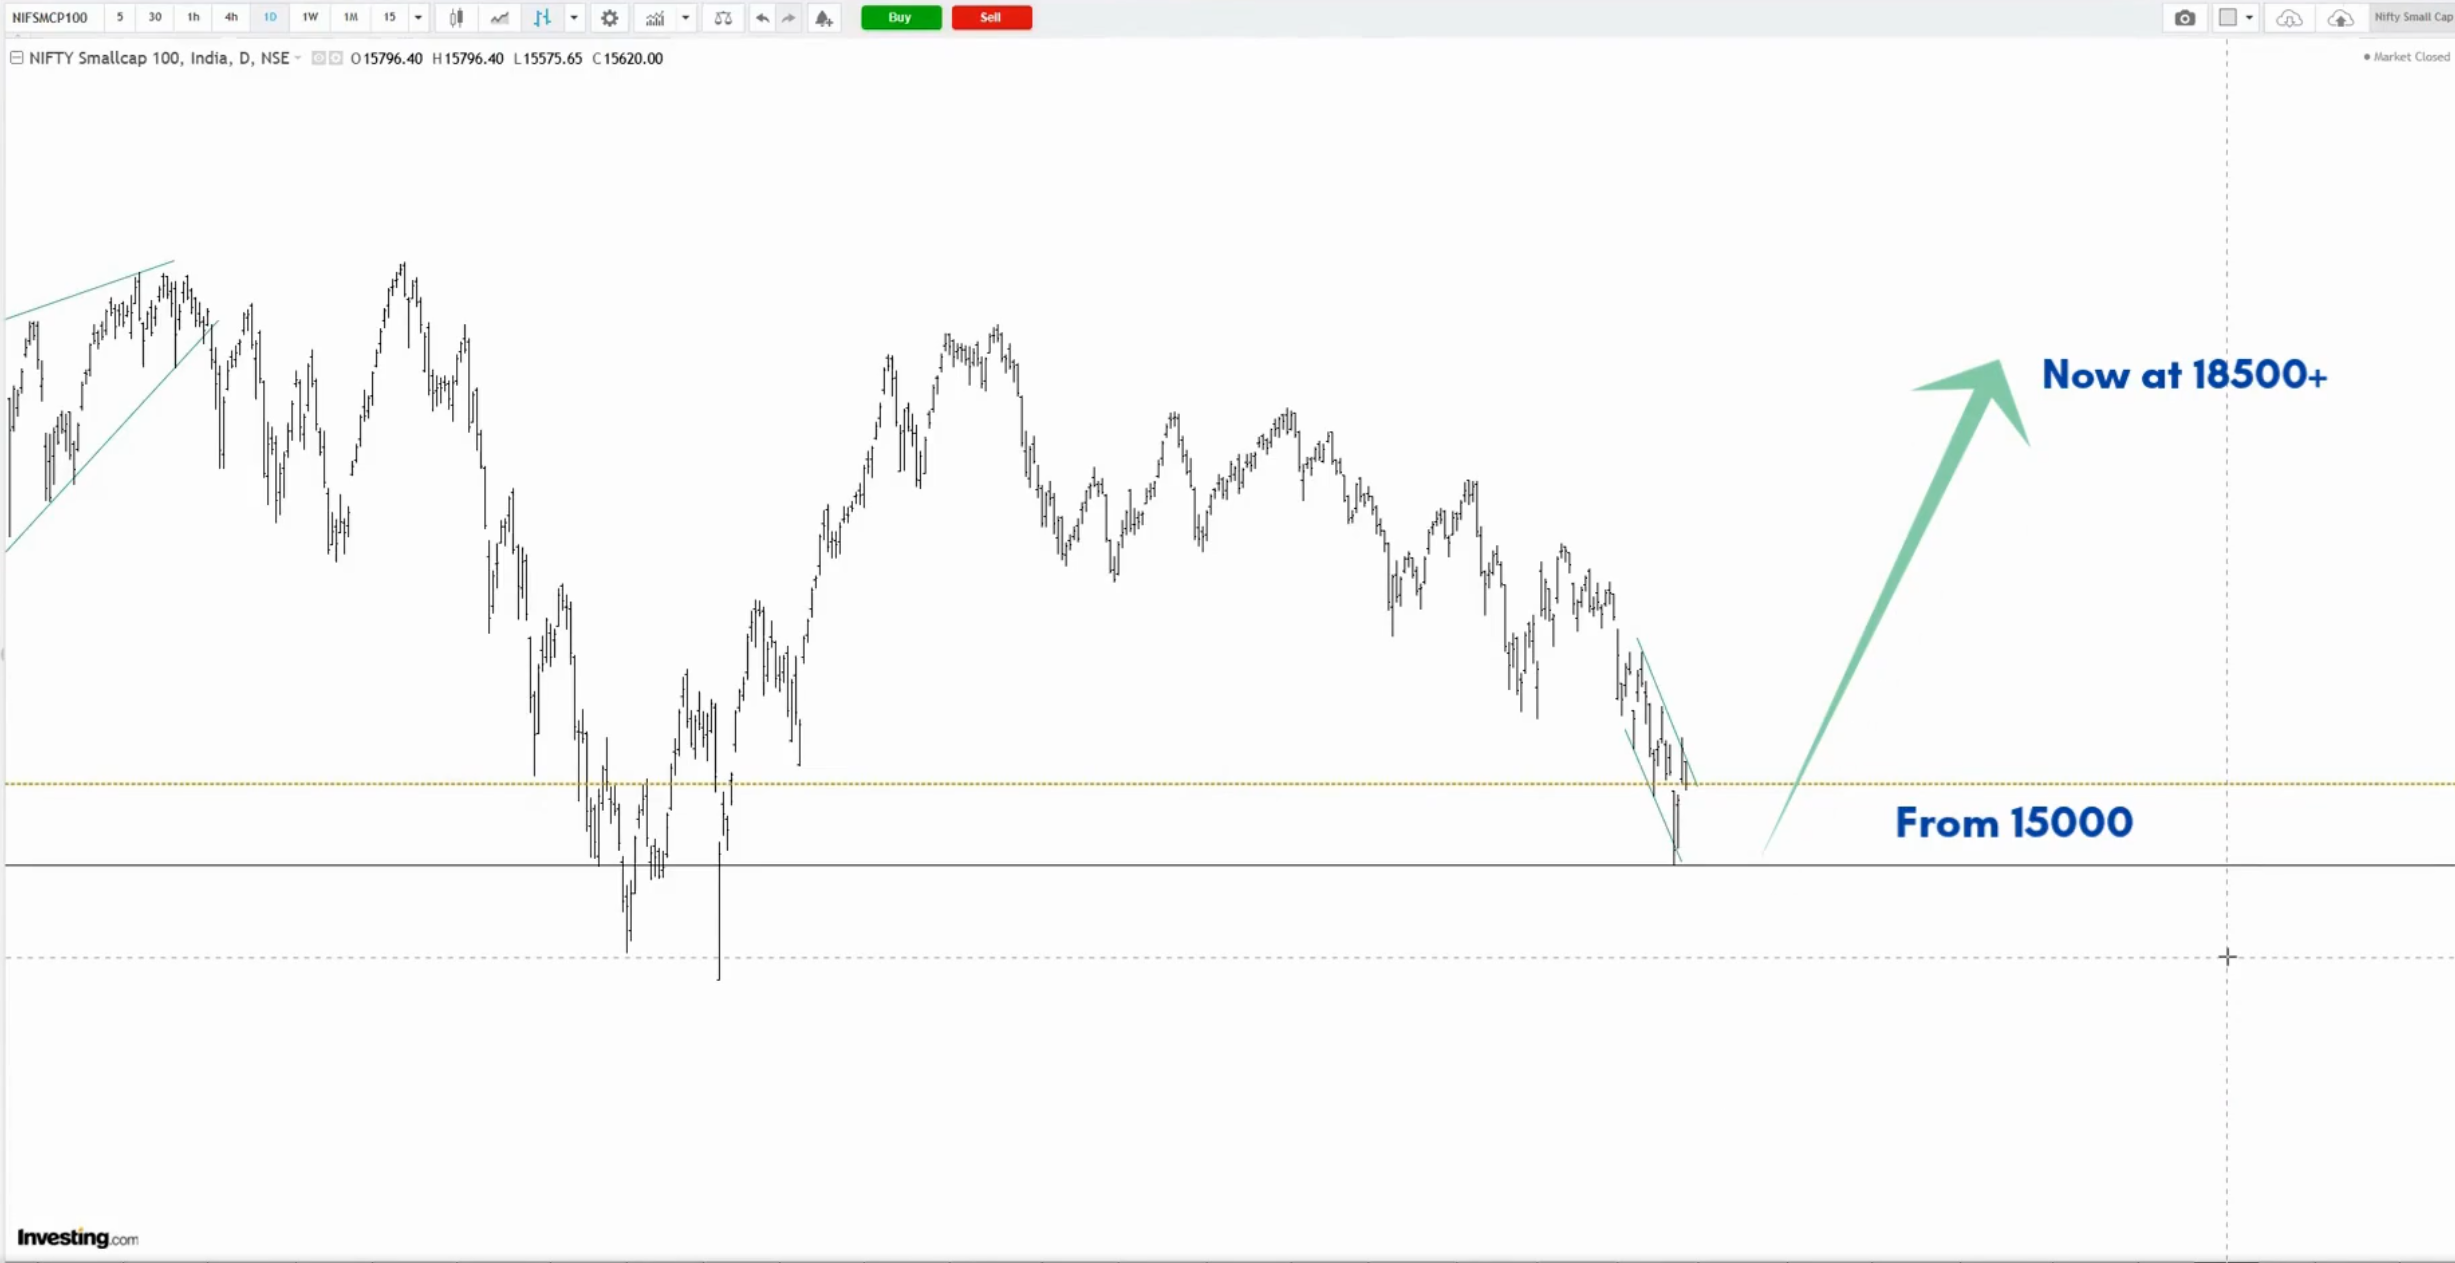
For learning purposes, below are some of the charts from our earlier analysis, where we identified the possibility of the correction continuing in December 2025 and later anticipated a reversal in March 2026.
We also explained in one of our videos (clip attached) that the Small Cap could be the first major index to show signs of a reversal in March. With the help of intermarket divergence, the Small Cap subsequently reversed as anticipated.
In December 2025, a chart showing our expectation for the correction to continue
In February, although the price had already reached our expected zone, the internal wave structure indicated that another leg could follow after a bounce. We anticipated this move and the market subsequently moved precisely as we expected
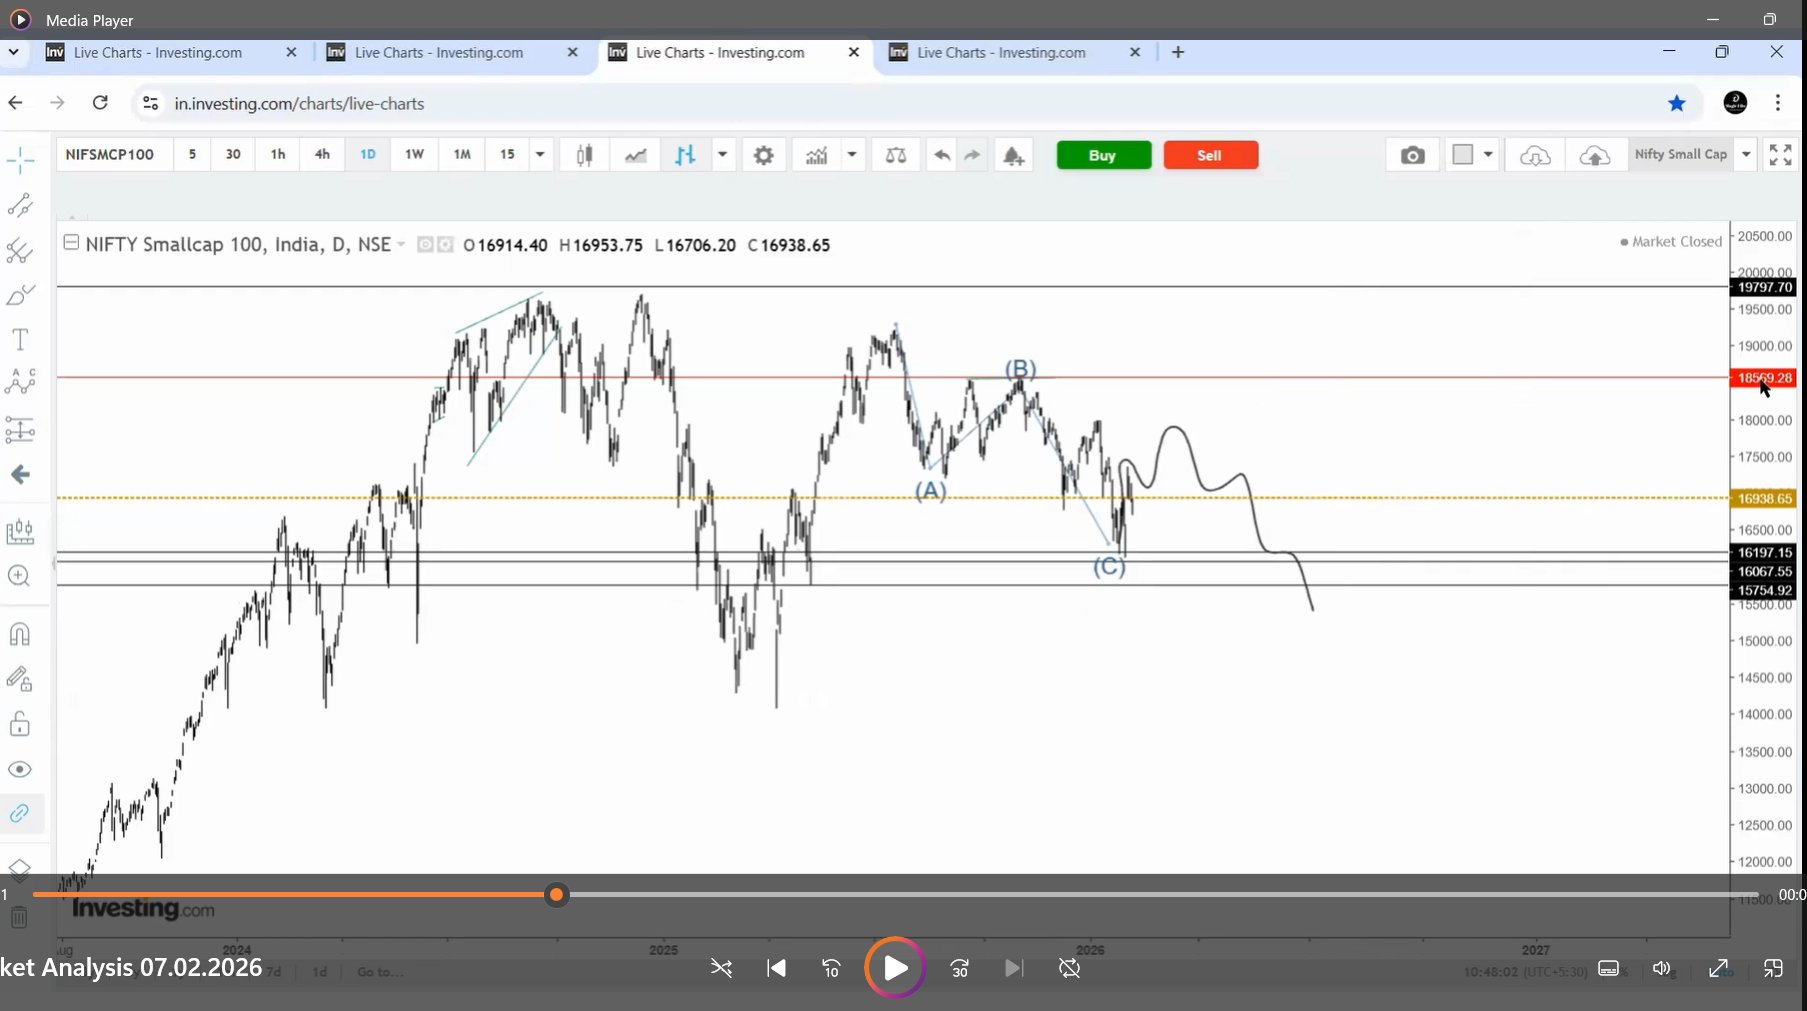
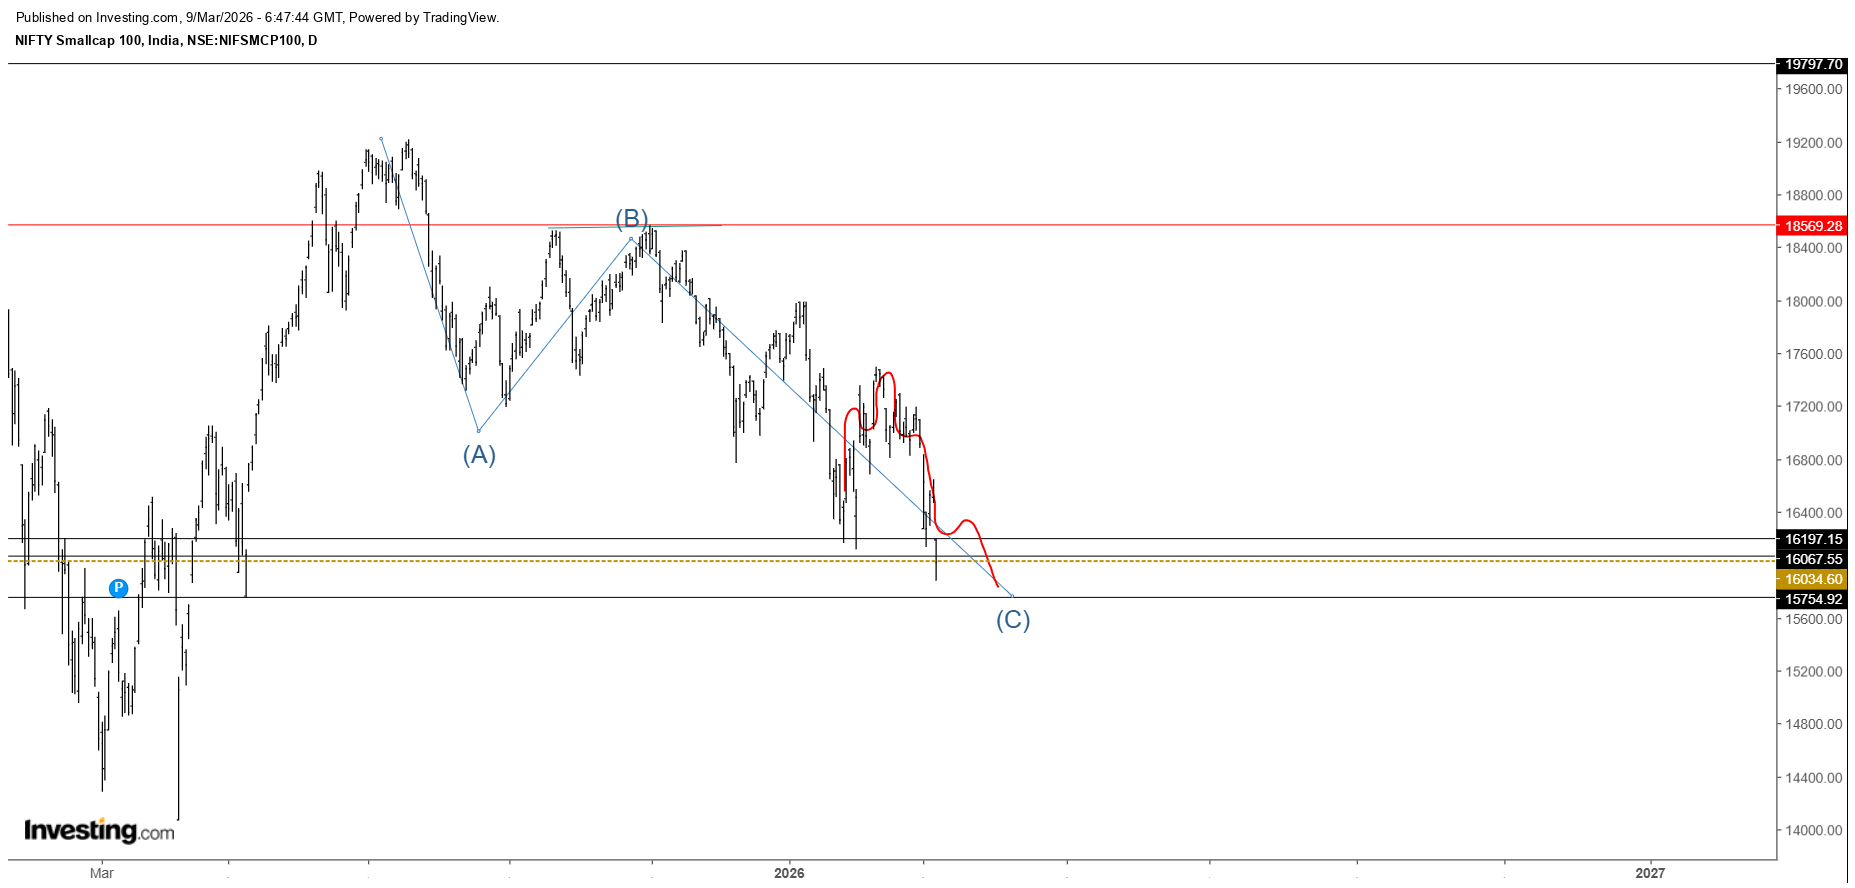
On 28 March 2026, I shared in one of my YouTube videos that the Small Cap could be the first major index to show a reversal through intermarket divergence. The subsequent price action aligned with this expectation.
✔️Link to this short clip (X) - https://x.com/itzarunca/status/2051991931048337509?s=20
NOTE : As always, wave analysis is not about predictions; it’s about preparation. Understanding the wave structure helps traders stay ahead of major moves, avoid traps and approach the market with clarity instead of emotion.

📌 Technical Analysis Course - Master The Markets

Arun Kumar
Magic Fibs ®