There are no items in your cart
Add More
Add More
| Item Details | Price | ||
|---|---|---|---|

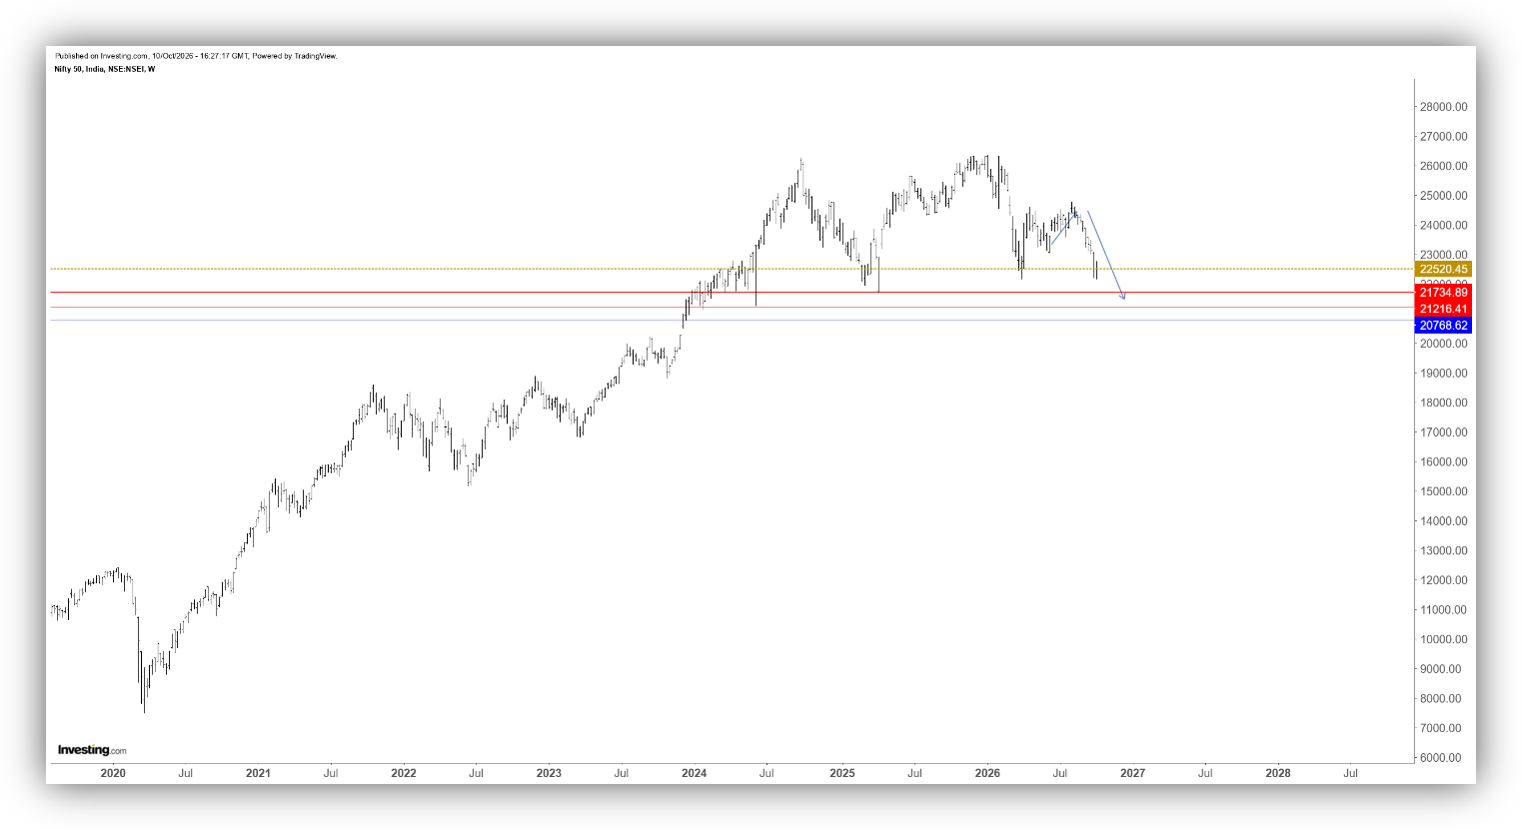
This week, particularly on 08.10.2026, Nifty moved below the previous low of 22,182.55, recording a low of 22,179.90. This confirms our view that Nifty is still in a corrective pattern, in simple, no new impulse wave has been started yet. The key question now is, where could this nearly two-year-long consolidation/corrective pattern come to an end?
11.10.2026
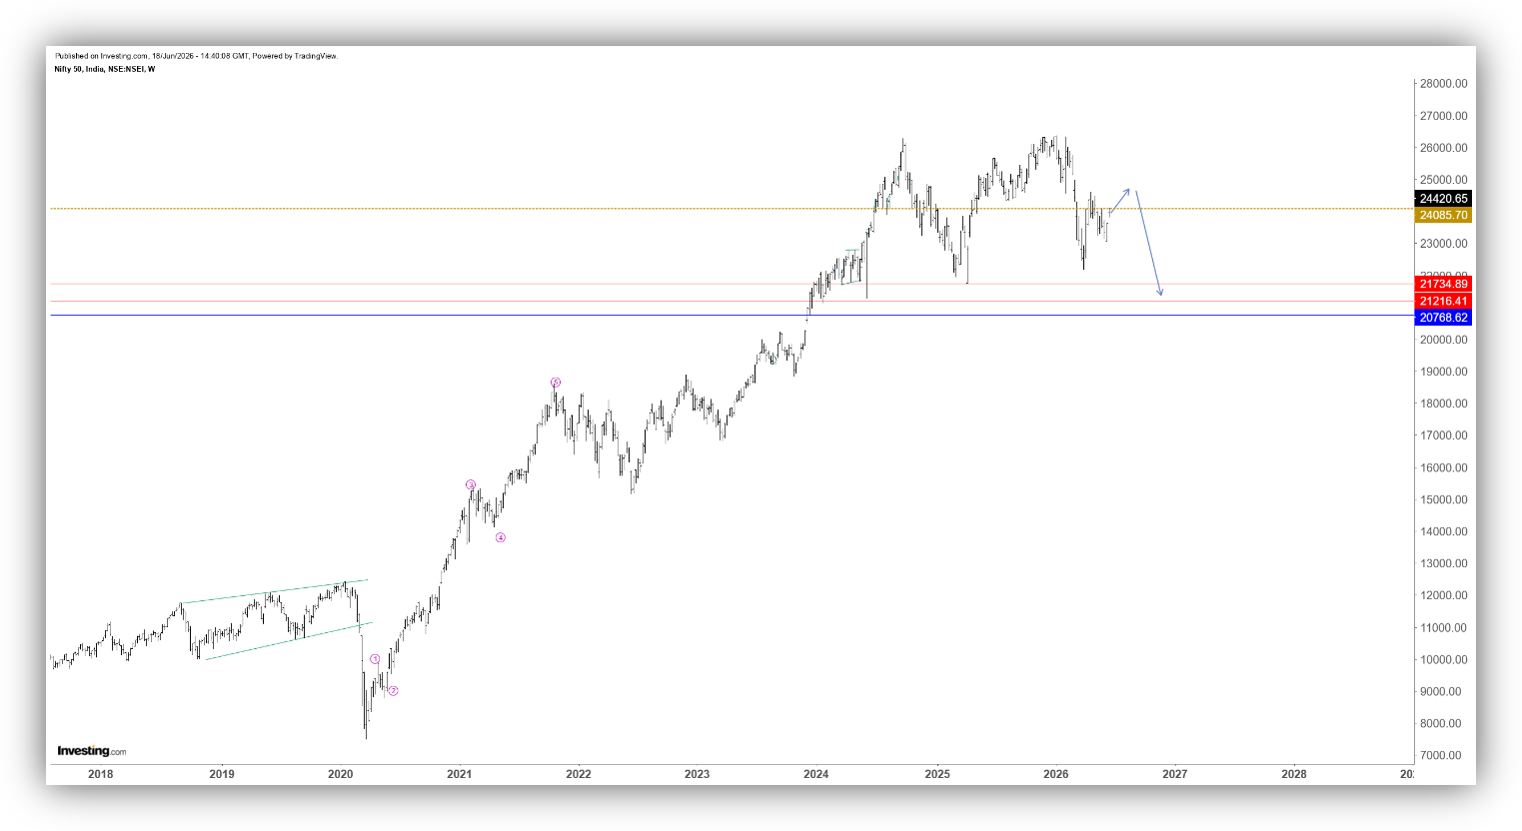
Our expectation in June 2026
Nifty Chart as on 10.10.2026
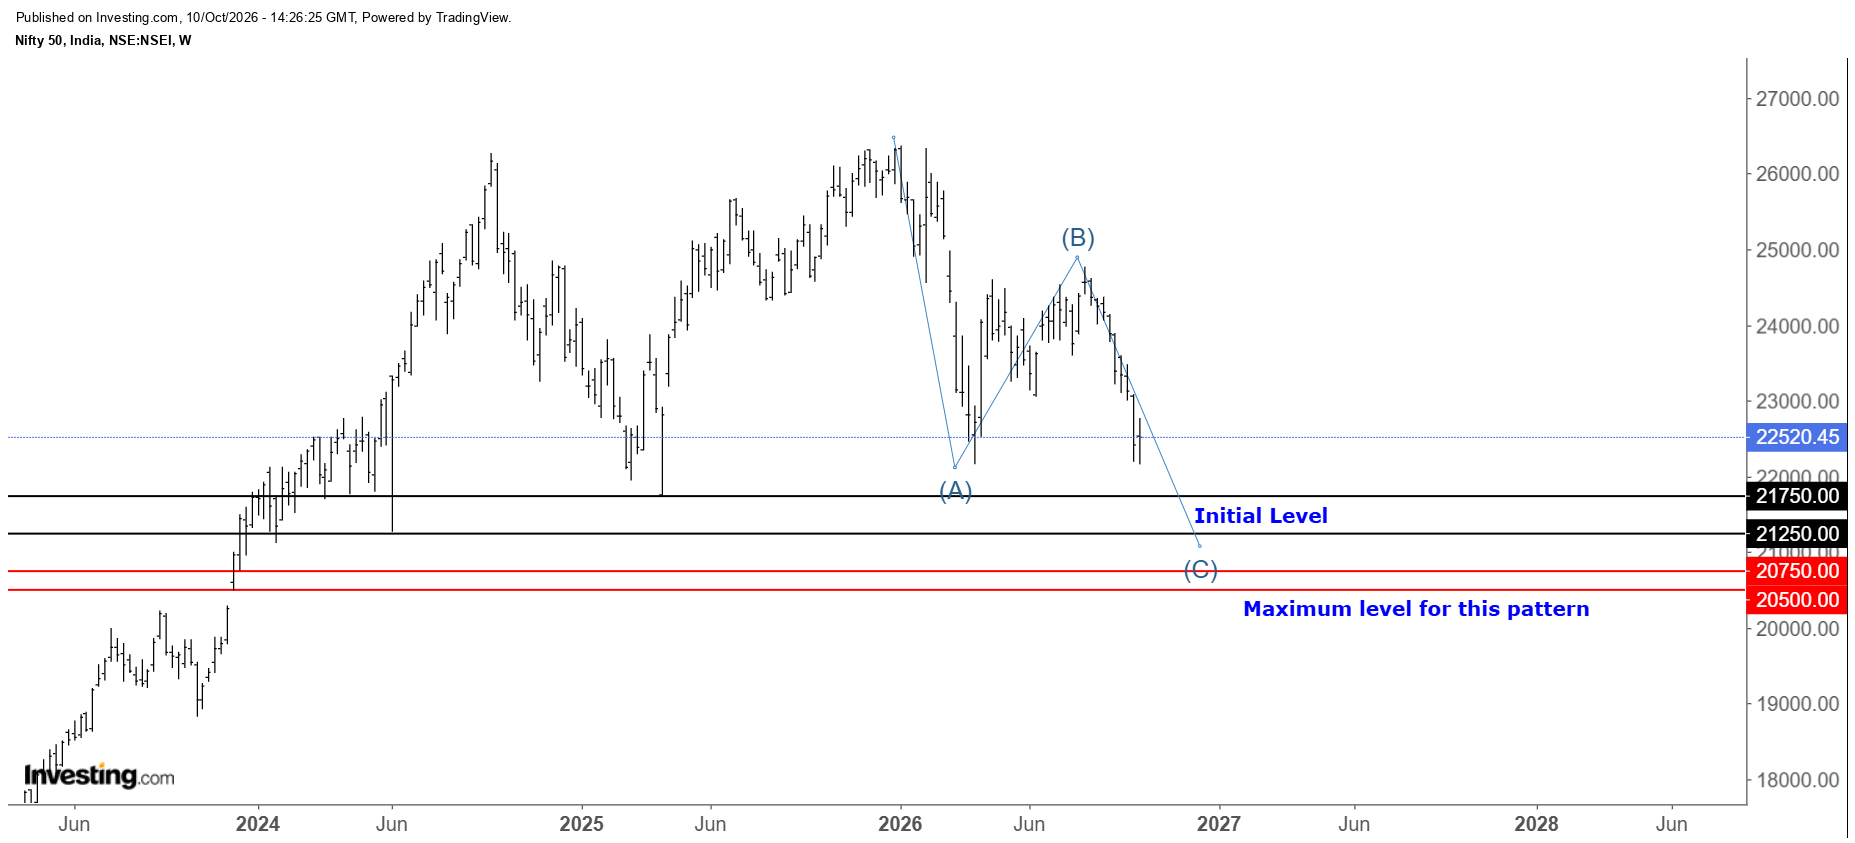
As you can see in the chart above, it is clear that I expected the entire pattern from the top as corrective and that is why I am expecting the price to break below 22,182.55 and also marked certain levels where this corrective pattern may potentially reach, broadly, between 21,750 – 20,500.
We also discussed in our video published in July 2026 the possibility of a reversal from this zone, in line with our broader Elliott Wave analysis.
Nifty Expectation in July 2026
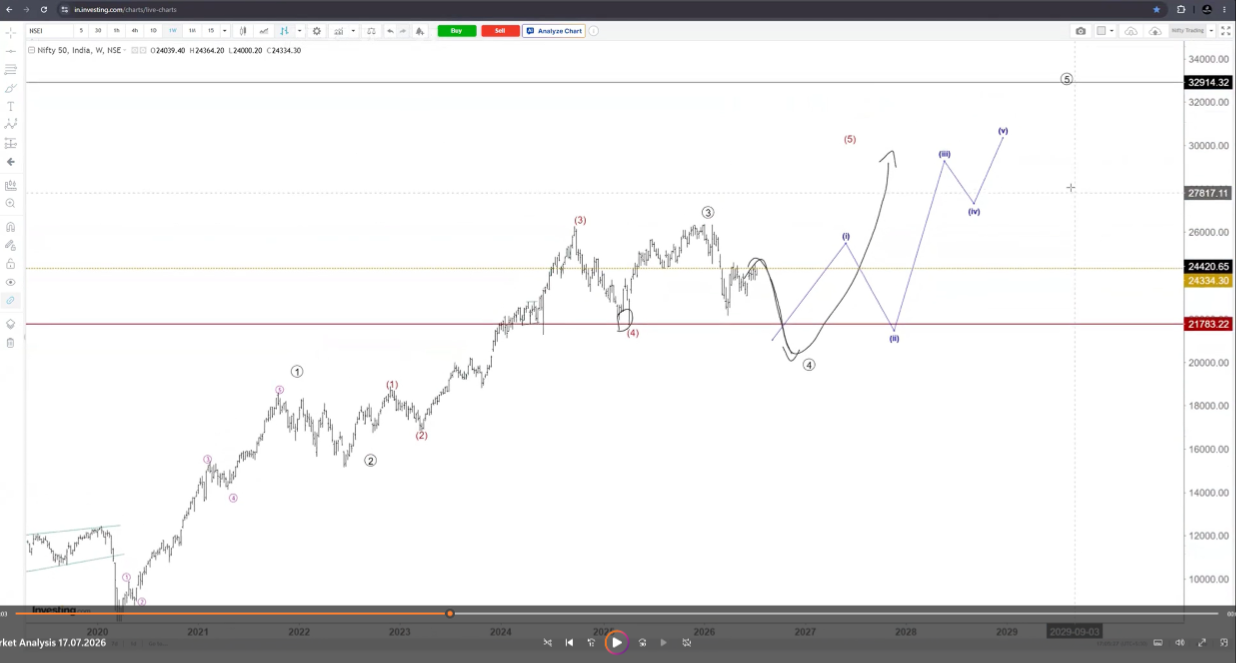
So, the idea here is, Nifty needs to move below or at least reach 21,750 to satisfy the minimum requirement for this corrective pattern.

Where Could This Correction End?
The initial potential reversal zone is between 21,750 and 21,250. However, if the correction extends further, the maximum potential reversal zone could be between 20,750 and 20,500.
Identifying the bottom
To identify the potential bottom in the Market, we need to consider the major indices as well, including Nifty, Bank Nifty and the Broader Market indices such as Small Cap, Mid Cap and Nifty 500.
As Nifty approaches our expected reversal zones, both the initial and maximum zones, we also need to look for confirmation of potential reversals in the other indices. This broader market assessment will help us evaluate whether the correction is nearing completion.
Can we expect any bounce before reaching these levels?
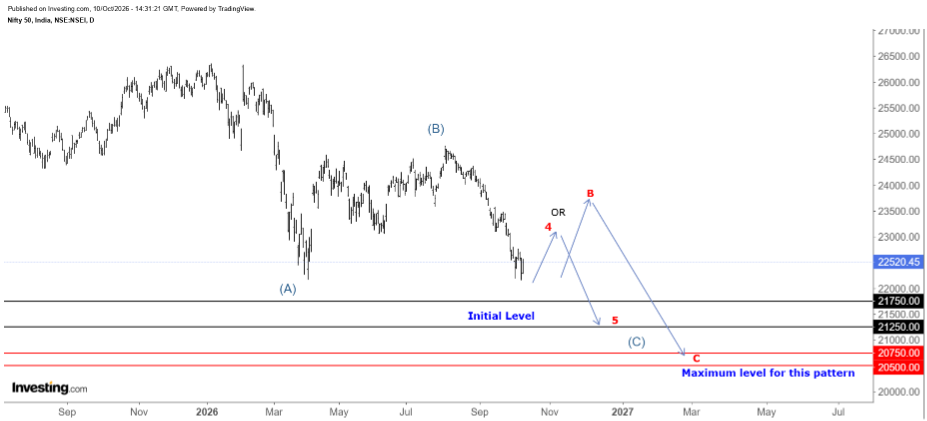
Yes, we can expect a decent bounce in between this corrective structure, a Wave 4 bounce, which is generally smaller, or a Wave B bounce, which could be larger and then it may continue to reach its corrective pattern’s price objective. My primary expectation is a Wave 4 bounce.
This is my expectation as of today (10.10.2026)

Long Term Wave Count and upside potential
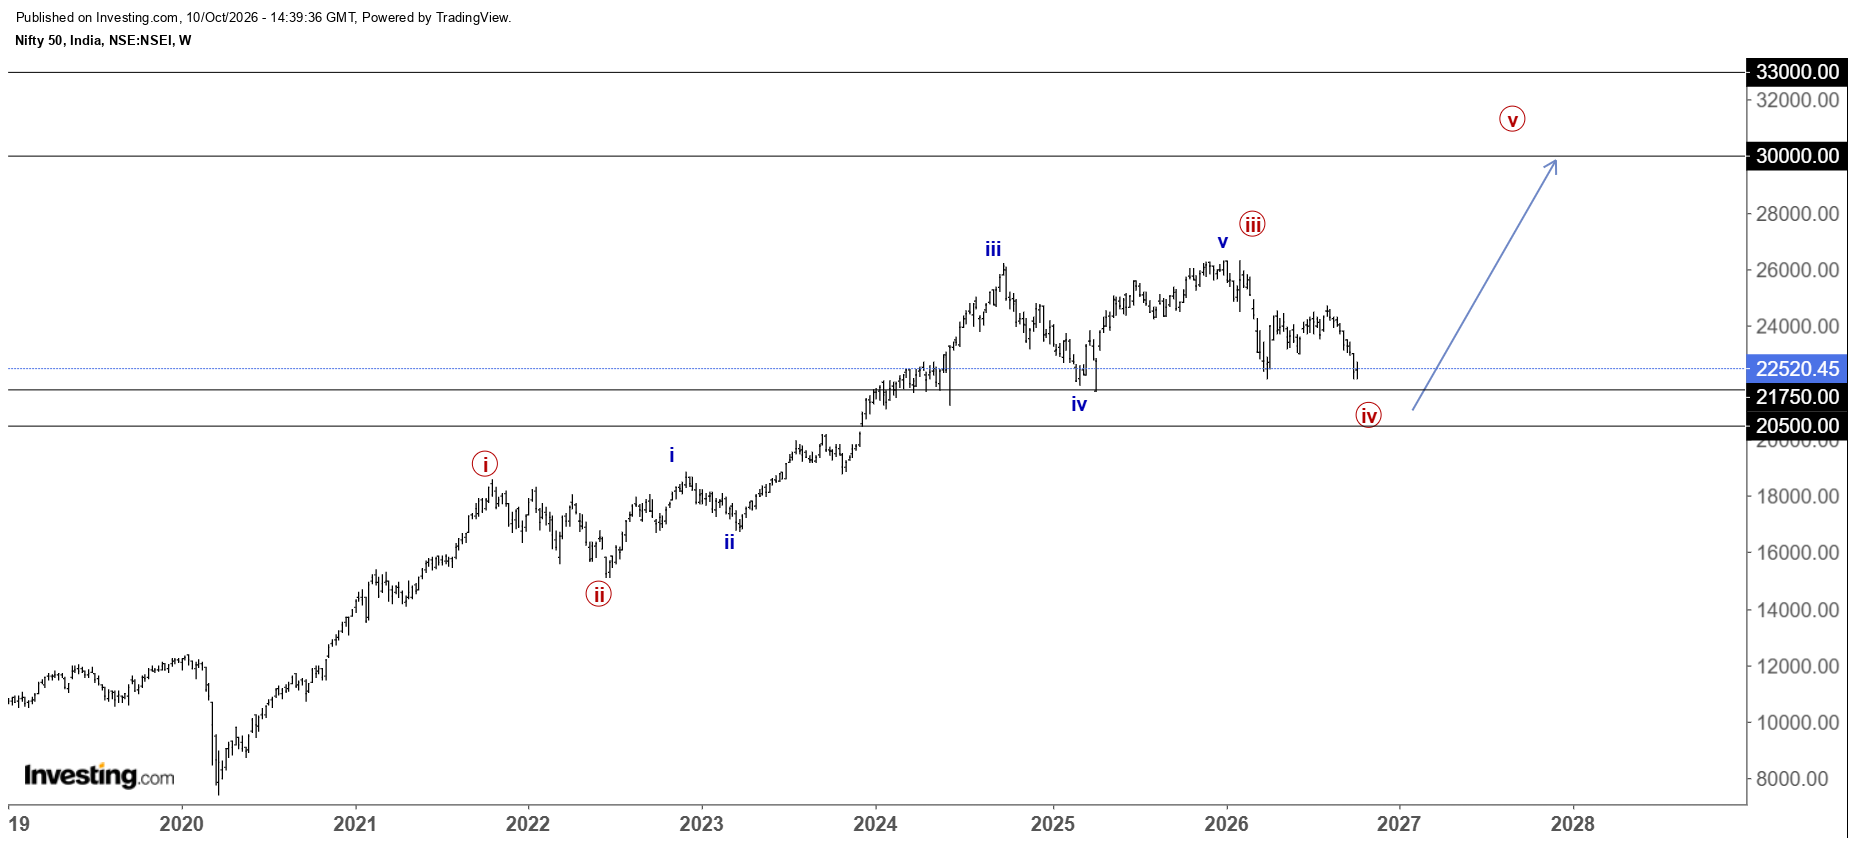
Taking a conservative approach, I am considering the high of 26,373.20 recorded on 05.01.2026 as the end of Wave 3. Based on this wave count, I expect the subsequent Wave 5 to reach the 30,000–33,000 zone.
In fact, my expectation is for an extended Wave 5, which could potentially push Nifty beyond this projected range.
VERY IMPORTANT NOTE – When we can get a deeper correction?
As mentioned earlier, identifying a potential market bottom requires more than analyzing Nifty alone. We need to consider other important indices including Bank Nifty and the broader markets.
In my opinion, if any deeper correction to develop (indeed, a very deeper one), it could be driven by a decline in the broader markets. We also need to consider other factors, such as crude oil prices and US markets, which is approaching a significant top.
Although I am expecting a possible divergence, with Indian markets moving higher while US markets move lower, these factors are to be considered.
At present, I am not having the option of deeper decline but to stay updated on any changes to my analysis and to follow my regular market updates, you can follow me on X or subscribe to my YouTube channel.
👉You Tube - https://www.youtube.com/@magicfibs


Arunkumar
Magic Fibs ®