There are no items in your cart
Add More
Add More
| Item Details | Price | ||
|---|---|---|---|


While analyzing a few global indices on the higher time frame, the NASDAQ 100 seems to be approaching a significant top that could lead to a 25%–35% decline. Let's examine the probability of this decline, the important levels to watch near the top and the potential downside targets if the correction begins.
17.07.2026
A Small Decline Before the New Highs
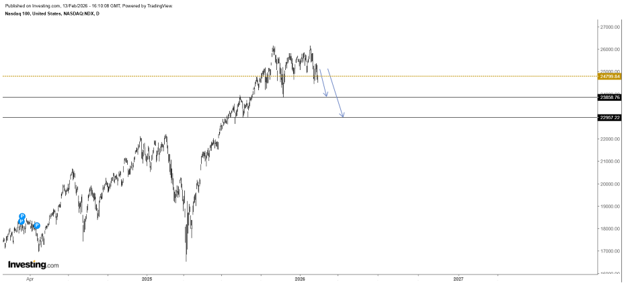
During February and March, I observed signs of weakness in the NASDAQ 100 and shared my expectation that the index could decline toward the 22,900 support zone before resuming its uptrend. I also expected the market to reverse from that region and move to new all-time highs. The chart below, shared in February 2026, illustrates this projected decline toward the 22,900 zone.
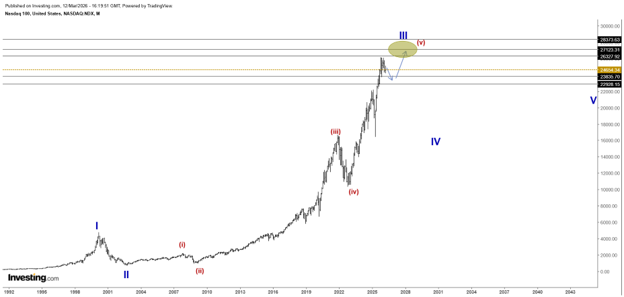
The chart below, shared in March 2026, illustrates the expected decline toward the 22,900 support zone, followed by a reversal toward the 28,400 zone.
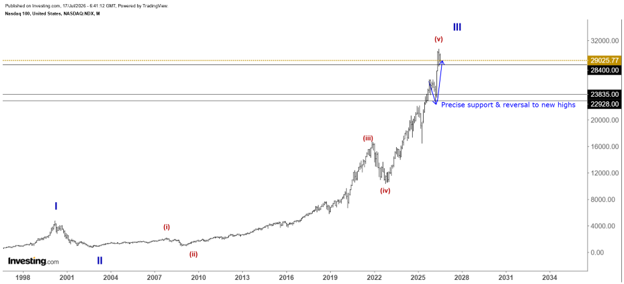
The chart below shows how the NASDAQ 100 found precise support in the 22,800–22,900 zone before reversing to new all-time highs. The index has now reached our projected target zone of 28,400, exactly as anticipated.
A) In Monthly time frame
B) Precise support and reversal to new highs (weekly TF)
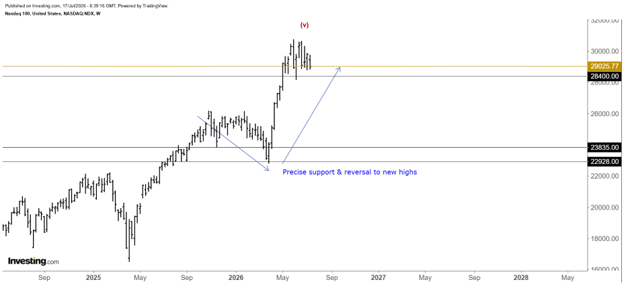
When I shared my analysis in March 2026, I initially expected the 28,400 zone to act as a significant top. So far, the price has faced resistance and is currently consolidating within our projected target zone.

However, in Elliott Wave analysis, wave personality is often more important than price targets alone. Based on the current structure, I believe there is still a probability that the NASDAQ 100 could break higher, register one more new all-time high and complete the ongoing impulse wave.
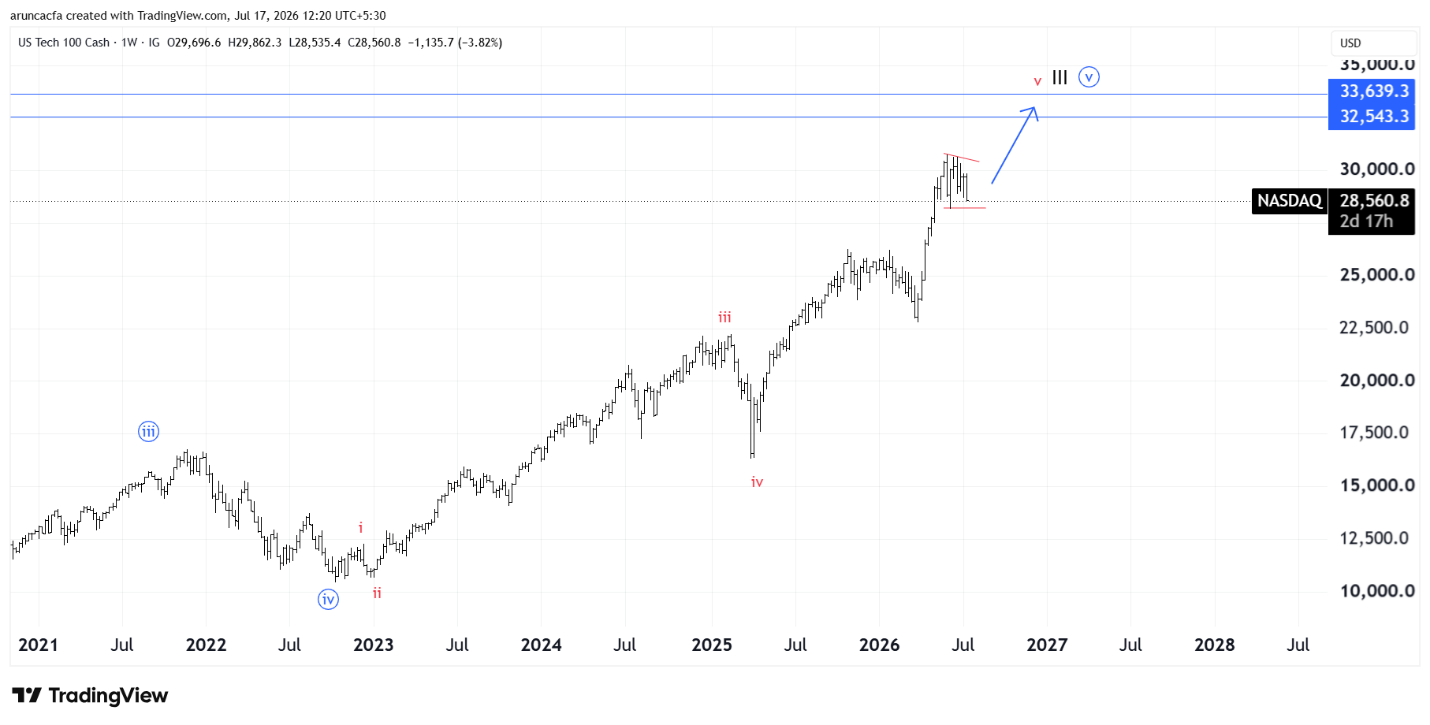
But remember, for the NASDAQ 100 to make another new high, a clean breakout is a must. If the index breaks out convincingly, it could rally toward the 32,500–33,600 zone.
Below is my immediate-term expectation, considering the probability of one more move to new highs.

Why Could the Next High Be a Significant Top?
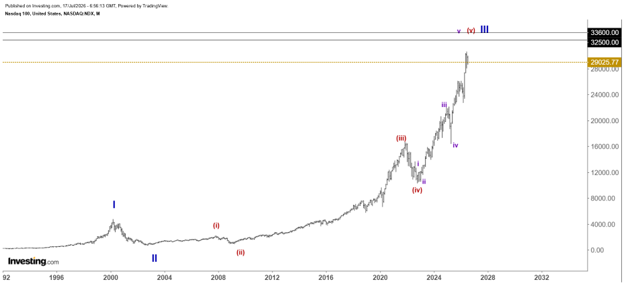
From a higher-time-frame perspective, the NASDAQ 100 appears to be progressing within Wave III of the larger Elliott Wave structure. The current advance can be interpreted as Wave (5) of Wave III. If the index extends to one more new high, that move could complete Wave V of (5) of Wave III.
It is important to note that this bullish scenario (another high) remains valid only if the NASDAQ 100 delivers a clean breakout above the current resistance. Otherwise, the significant top may have already been formed around the 30,700 zone.
If this wave count is correct, it would indicate that the larger third wave is approaching completion. Since third waves are typically the strongest and most extended phase of an impulse, the completion of Wave III could be followed by a meaningful corrective phase before the next major advance begins.
What If the Decline Begins?
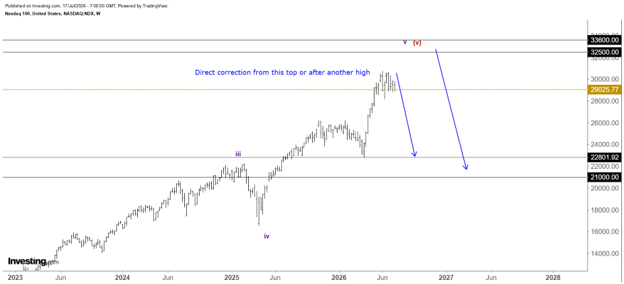
If the expected top is confirmed, it could mark the completion of Wave III, leading to a meaningful corrective phase.
Based on the current Elliott Wave structure, I expect the NASDAQ 100 to decline toward the 23,000 zone at a minimum. Depending on the internal wave structure that develops during the correction, the decline could extend further toward the 21,000 zone.
Assuming the index makes one final new high above 32,500, this would imply a potential correction of approximately 25% to 35% from the peak.
When Should This View Be Reconsidered?
The key point to remember is that the current impulse appears to be Wave III and third waves are known for their ability to extend. Therefore, the only scenario that would alter this outlook is if Wave III continues to extend, delaying the formation of the expected top.
However, such an extension would not invalidate the larger bearish outlook. Instead, it would simply postpone the correction. In fact, once the extended third wave is complete, the NASDAQ 100 could experience an even deeper corrective phase due to the strength and magnitude of the preceding rally.
Final Thoughts
The NASDAQ 100 appears to be approaching a significant top. Based on the current Elliott Wave structure, there is a reasonable probability that the index could undergo a 25%–35% correction once the current bullish phase is complete.

Key Points to Remember
As always, wave analysis is not about predictions; it’s about preparation. Understanding the wave structure helps traders stay ahead of major moves, avoid traps and approach the market with clarity instead of emotion.
✨Learn the PUREST FORM OF ELLIOTT WAVE TRADING✨
🎯Learners across 12+ Countries with a complete 5-star-rated, most practical course
📌Elliott Wave Course - Waves Leads the Price®
https://www.magicfibs.com/courses/Waves-Leads-The-Price-From-Magic%20Fibs-65e54218ce6d877f516ed105
📌PACKAGE - Elliott wave and Technical Analysis (with additional DISCOUNT)
Arunkumar
Magic Fibs®