There are no items in your cart
Add More
Add More
| Item Details | Price | ||
|---|---|---|---|


The Elliott Wave framework had already signalled the possibility of this decline as early as June 2025. While the market is now widely discussing the brutal sell-off in the IT sector, this scenario was outlined and discussed in our videos back in June 2025 — and notably, with precise projections.
{{DATE}}
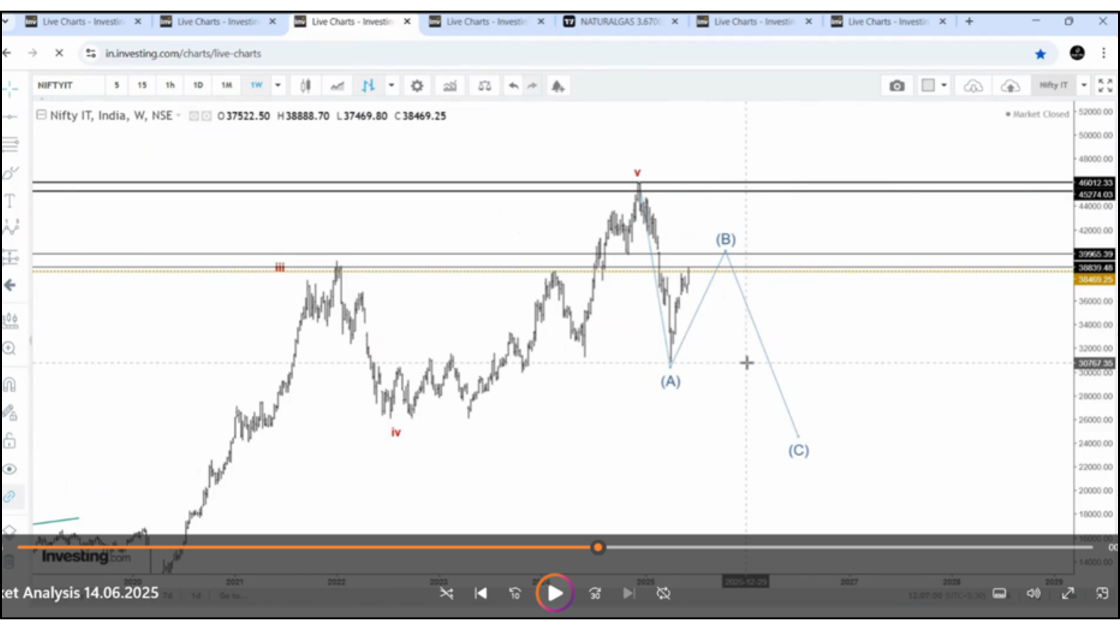
1. First, why did this fall occur, and how was it anticipated?
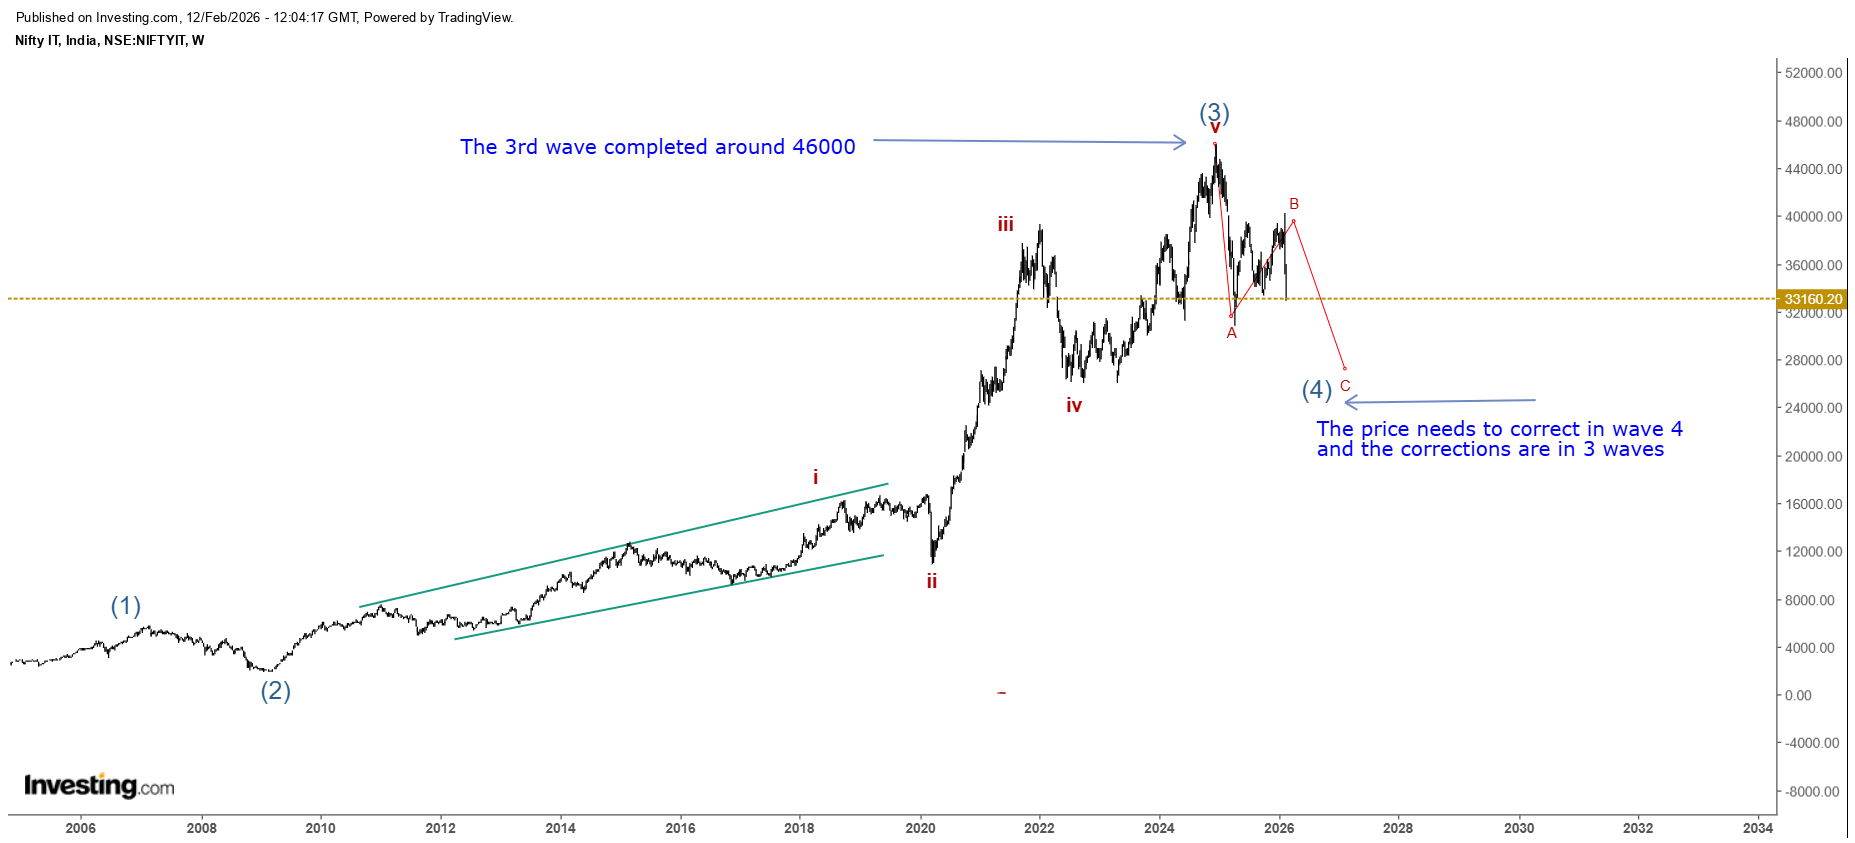
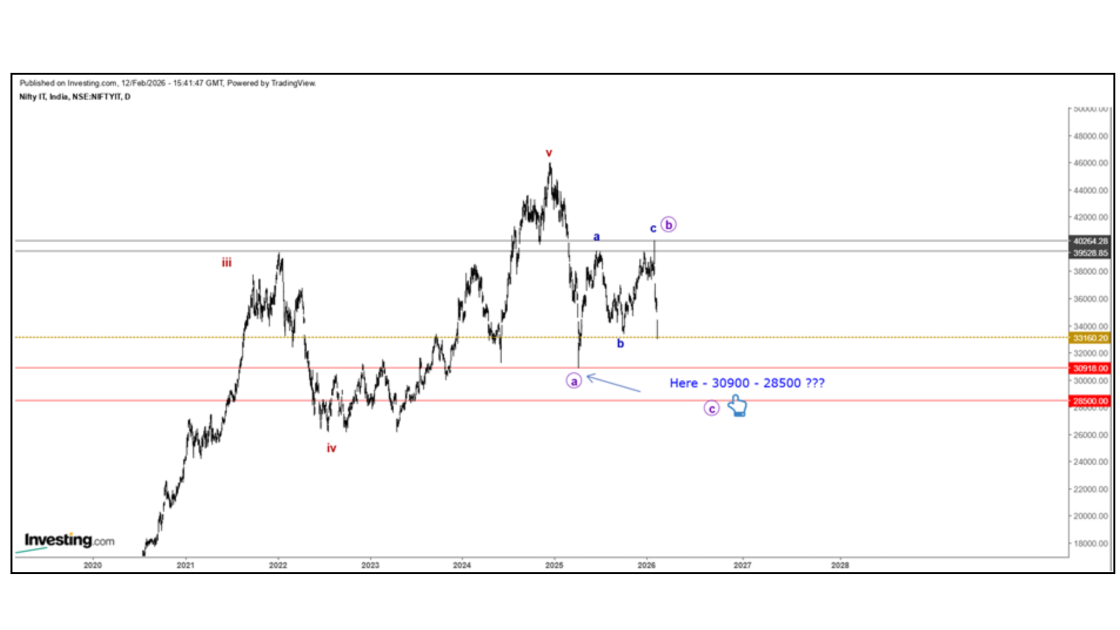
To answer this, we must examine the IT sector on higher time frame rather than focusing on short-term price movements. On the weekly chart, the third wave appears to have completed near the 46,000 level. Following this, a fourth wave correction unfolded, which eventually pushed the index below 31,000. This marks a decline of roughly 15,000 points —a drawdown of more than 30% from the peak.
2. Why is this 30% decline still not sufficient?
From a purely price-based perspective, a 30% correction may appear significant. However, within the Elliott Wave framework, the decline has not yet fulfilled its broader objectives — both in terms of pattern structure and projected price targets. Let us first focus on the structural aspect of the pattern. The discussion on price objectives for this correction will be addressed subsequently.
3. Pattern Objective
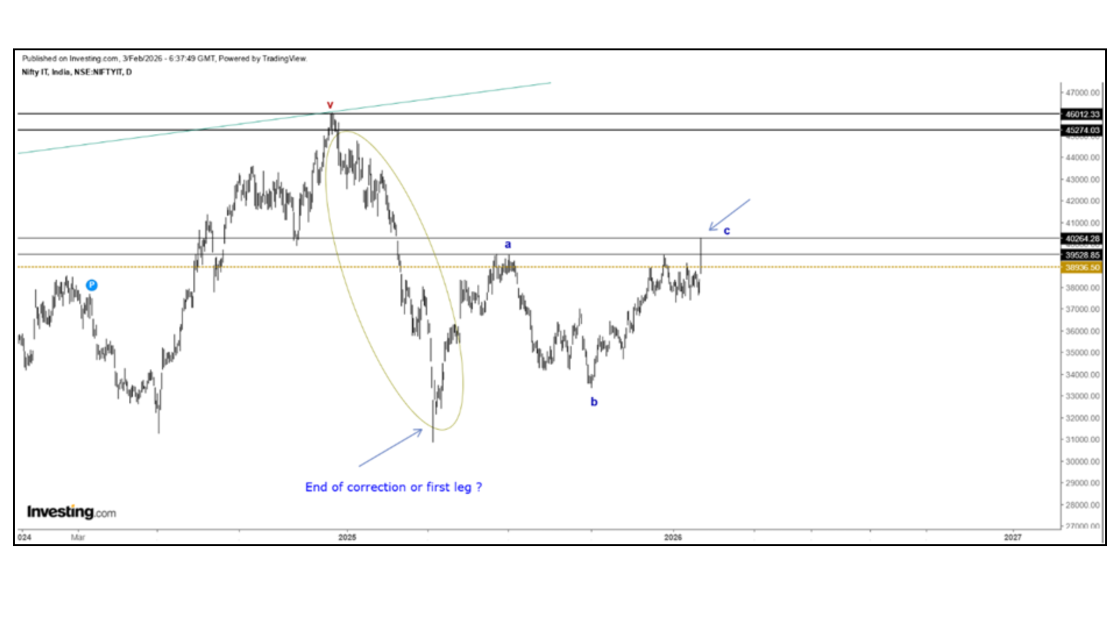
According to Elliott Wave theory, corrective structures typically unfold in three waves. In this case, the primary trend of the IT sector remains upward, making the Wave 4 pullback a corrective phase rather than a trend reversal. Despite the sector experiencing a 30% decline, the correction appears to have completed only its initial leg. As discussed earlier, corrective patterns generally develop in a three-wave sequence known as the ABC structure. Based on this framework, the recent decline was identified as Wave A, with Waves B and C expected to follow. The chart below illustrates these concepts, highlighting the completion of Wave 3, the development of Wave 4, and the anticipated three-wave corrective structure.
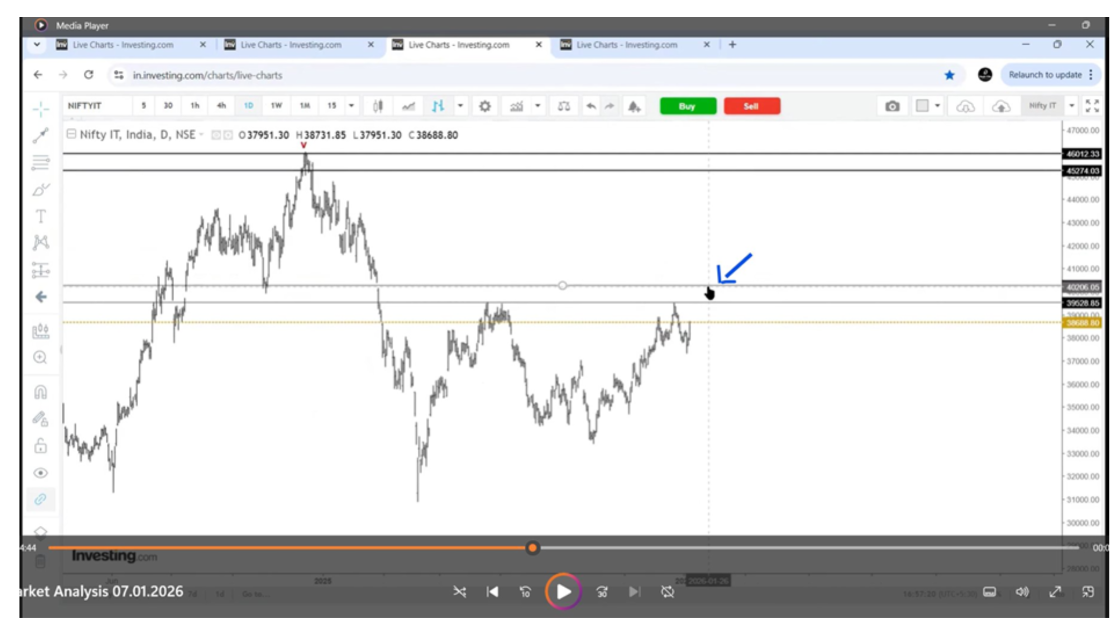
4. How did we anticipate the precise rejection near 40,300?
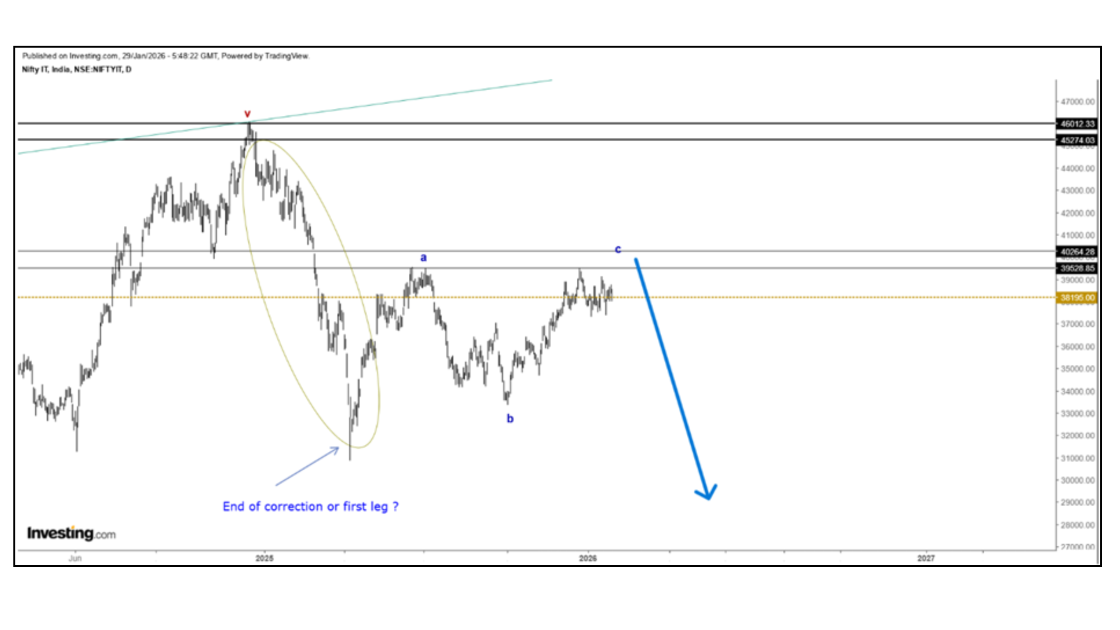
Let us now shift our focus daily chart to examine the internal structure of the Wave B advance.
Corrective patterns typically unfold in a three-wave structure. Since Wave B itself represents a corrective move within the larger Wave 4 decline, we expected this rise to also develop as a three-wave formation.
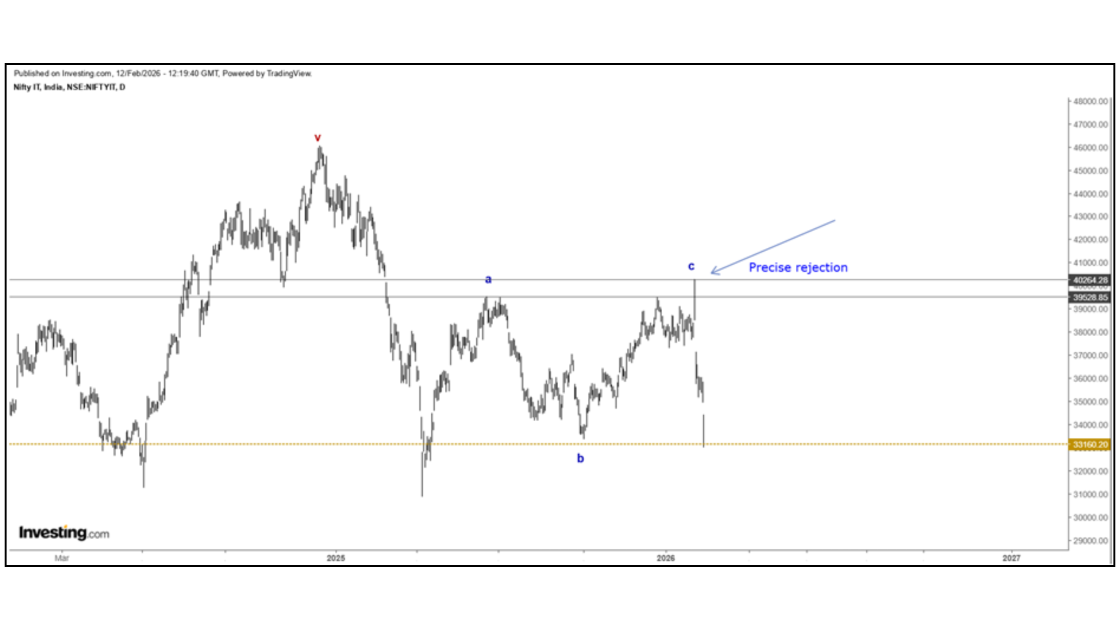
Using this framework , along with Fibonacci retracements and projections, we identified a high-probability resistance zone near the 40,264 level, where a strong rejection was anticipated.
Precisely, the actual peak occurred at 40,381, after which the index declined sharply. As of today (12.02.2026), the sector has fallen more than 7,200 points - a drawdown of approximately 17%.
5. All of this is now history. The real question is: What comes next?
Now the Price Objective
Based on the corrective structure discussed earlier, the price is expected to move below the larger Wave A low, located near the 30,918 level (as marked in the chart). Applying typical Fibonacci relationships observed in corrective sequences, the projected downside objective falls within the 28,500 – 31,000 region. This zone represents the minimum expectation for the completion of the ongoing pattern.

6. If the previously discussed zone represents the minimum expectation, what could be the deeper downside scenario?
The immediate focus should be on how price behaves upon approaching the 28,500 – 31,000 region. Reaching this zone alone does not confirm the end of the correction; the internal wave structure and momentum characteristics will be critical. If the internal price action continues to exhibit corrective behavior, the decline could extend further toward the 26,200 – 25,200 region.
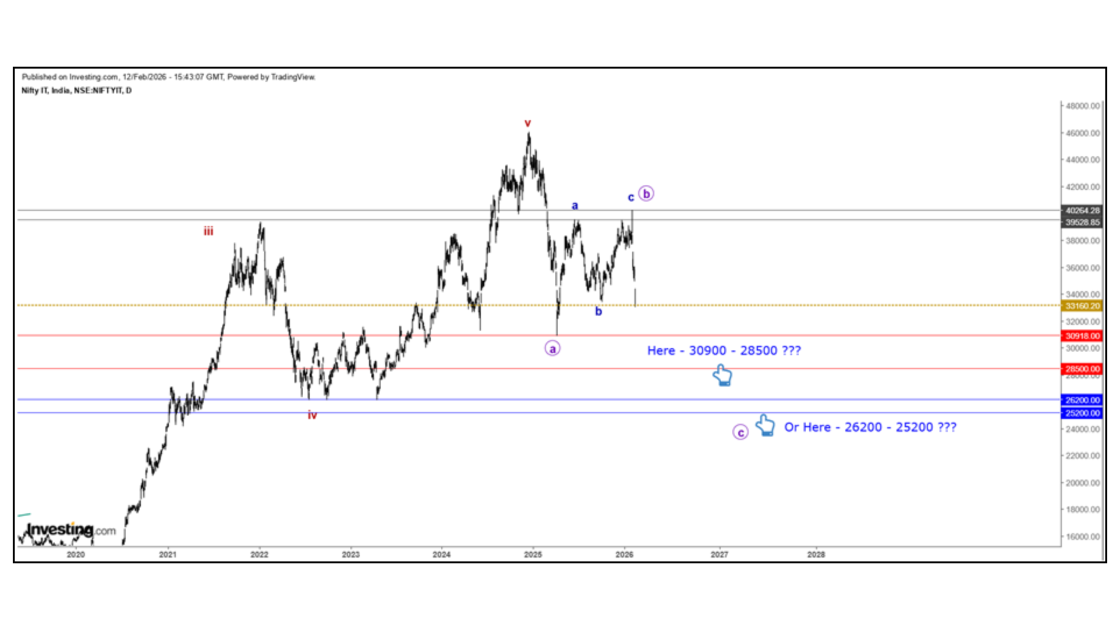 Is this the ultimate downside target? In market structures, there is never a fixed "maximum". However, based on the current pattern interpretation and prevailing wave relationships, these levels represent a reasonable deeper correction objective.
7. Conclusion
Regardless of whether the minimum or deeper price objectives are achieved, the IT sector remains in a prevailing downtrend at this stage. From an analytical perspective, the critical factor is not merely where price moves, but how it progresses toward those levels. The structure, momentum, and internal wave development will provide far more insight than the price itself. Upon the completion of Wave 4, Wave 5 is likely to resume the upward trend. Patience and observation remain essential.
8. Seeing Ahead of the Crowd: The Elliott Wave Perspective
One of the greatest advantages of understanding Elliott Wave theory is its forward-looking nature. In this instance, the framework provided directional clarity as early as June 2025. As I often emphasize, Elliott Wave analysis is not about prediction — it is about preparedness. When we are prepared for potential outcomes, we gain the invaluable benefit of time, allowing for rational and disciplined decision-making rather than emotional reaction

✨Learn the PUREST FORM OF ELLIOTT WAVE TRADING✨
🎯Learners across 12+ Countries with complete 5 star rated most practical course
Register to identify precise turning points, market reversals and clear targets with clarity. You can learn through my Elliott Wave course — WAVES LEADS THE PRICE.
👉Important Note: Make note of the Package Discount Coupon Code at the Checkout Page
🔗Course Links:
Elliott Wave Course - Waves Leads the Price
https://www.magicfibs.com/courses/Waves-Leads-The-Price-From-Magic%20Fibs-65e54218ce6d877f516ed105
PACKAGE - Elliott wave and Technical Analysis (with additional DISCOUNT)
https://www.magicfibs.com/courses/Technical-Analysis-Waves-Leads-The-Price-68205bdb78c5c22adf8916f3
Elliott Wave Course - Waves Leads the Price (TAMIL)
Disclaimer - I am not a SEBI-registered analyst or investment advisor. I do not provide any buy, sell, or investment recommendations, either directly or indirectly. All charts, market analysis, educational content, teachings, doubt-solving sessions, emails, and related communications are intended strictly for educational and learning purposes only. Any information shared should not be considered financial, investment, or trading advice. Users are advised to consult their own financial advisor before making any investment or trading decisions.

{{AUTHOR}}
Magic Fibs ®