There are no items in your cart
Add More
Add More
| Item Details | Price | ||
|---|---|---|---|

In January 2026, I informed my followers that both Gold and Silver could witness a deeper decline and that it was not the right time to buy. Just a week after my report, these precious metals lost their shine and declined sharply. In the same report, I also mentioned that new opportunities could emerge around mid-2026. Here is the updated report on Gold and Silver for the coming months.
29/05/2026
Link to watch the video - https://www.youtube.com/watch?v=4WW2QbHLynw

To gain a clear understanding, let us revisit the key points discussed in January 2026.
Both Gold and Silver were in Wave 3 and the sharp price action at that time was identified as wave (iii) of 3. Since wave (iii) of 3 was approaching a major resistance zone, I expected a decline or correction in wave (iv) of 3 from January 2026 onward. This was the core idea shared in my January report.
In simple terms, Gold and Silver were expected to form a short-term top, followed by a correction phase. That correction was projected as the next opportunity. Below are screenshots from that report (YouTube video).
Gold in January 2026
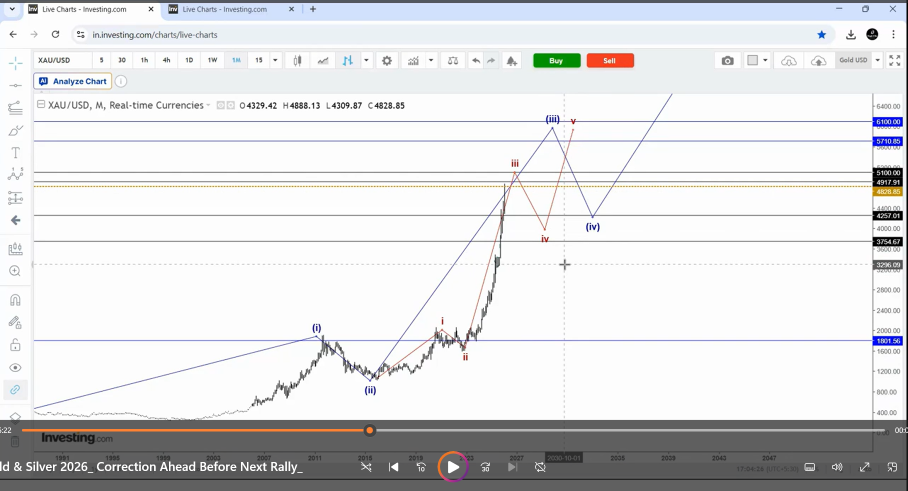
What we understood from these charts?
Short-Term View - GOLD
The price was approaching a major resistance zone and I expected the rally to end and followed by a sharp decline. The first resistance level marked was around $5,100 while the second resistance zone was around $5,700.
Initially, I expected Gold to reach the $5,700–$6,100 range during the larger Primary Wave 3. However, due to extreme optimism and market euphoria, the price surged to nearly $5,600 within this subwave itself. Interestingly, this level had already been marked as the second resistance zone well in advance in January 2026. Such projections are possible only with the help of Elliott Wave analysis and Fibonacci levels.
The most important takeaway from this chart is that we not only identified the resistance zones but we also discussed the probable support area where Gold could decline during the correction phase. The support range marked was between $4,260 and $3,750. As of May 2026, the low made was around $4,100, which is near the midpoint of this support range.
Below is the current chart of Gold
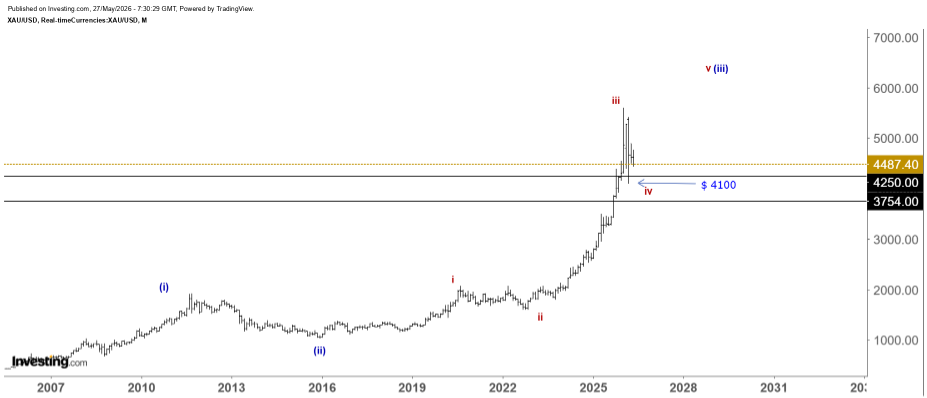
So, we not only anticipated the top but also projected the probable target zone for the next correction. The decline measured more than 1,500 points, which was approximately a 25% drop.
With the help of Elliott Wave analysis, it is possible to identify potential tops and bottoms well in advance. One may not always want to short the market at the top, but at the very least, such analysis can help avoid buying near euphoric highs driven by excessive optimism. It can also help investors and traders book profits from their existing long positions at the right time.
Why was a sharp fall expected? - The Theory of Alternation between Wave 2 and Wave 4

A similar view and approach were shared for SILVER during January 2026.
Silver in January 2026 (For clarity, only the internal structure of Wave 3 is marked)
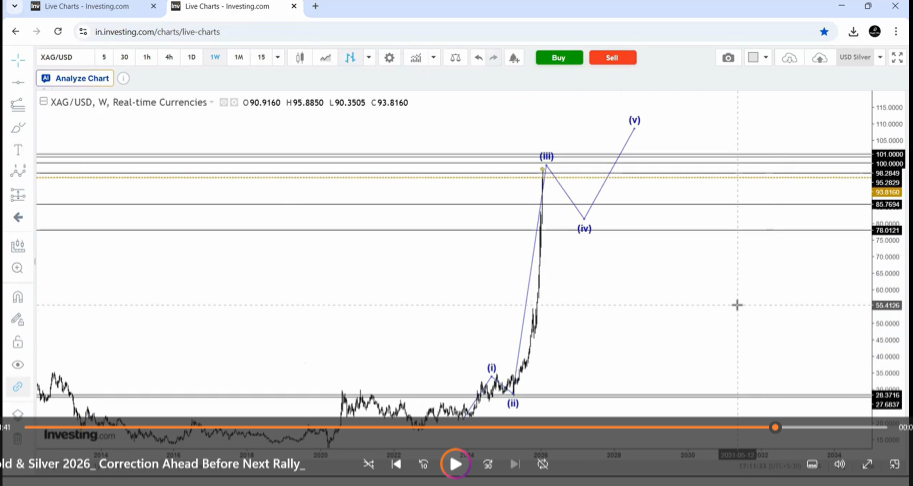
What did we understand from these charts?
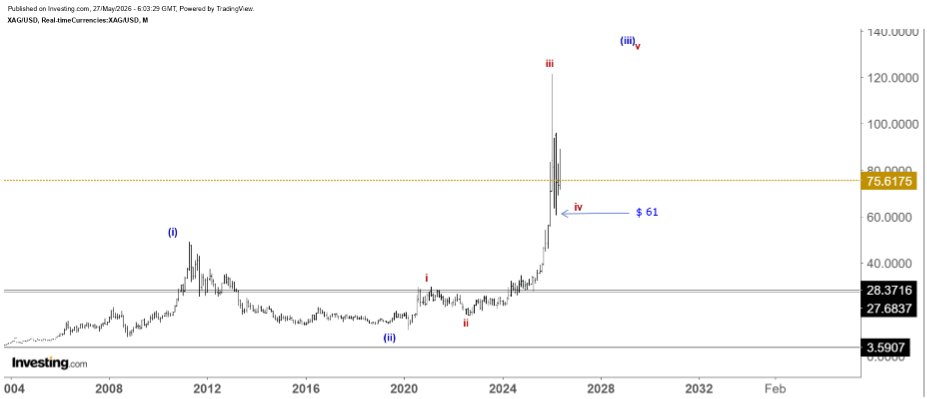
Short-Term View - SILVER
The price was approaching a major resistance zone and we expected the rally to end and followed by a sharp decline. Initially, I projected the resistance around $101. However, due to extreme optimism and bullish sentiment, the price moved higher and I slightly adjusted the resistance zone around $109.
When the price crossed $110, many believed that Silver would continue its rally indefinitely, and the price eventually surged toward $120. However, within the very next week, Silver experienced a brutal sell-off and declined sharply to nearly $64. A correction of approximately 50% in just one week.
Such a sharp decline could have been avoided if one understood how price structures and market psychology work. Elliott Wave analysis had already provided early clues that the market was nearing a top.
During January 2026, I had identified the possible correction zone around $78. However, due to extreme fear and the brutal sell-off, the price declined further. Based on the changing price structure, I later revised the expected support zone to around $69 but Silver eventually fell as low as $61.
Below is the current chart of Silver (May 2026)
What Next? Expectations for 2026, 2027 and Beyond
The price structure in both Gold and Silver still suggests that they are in Wave 3 and the current decline may be wave (iv) of 3. This means that the possible larger Wave 3 structure not yet completed in these metals.
If this interpretation is correct, wave (v) of 3 could begin during the second half of 2026. In simple terms, the current decline may be followed by another strong upward move before a larger Wave IV correction develops later. After that, an even bigger Wave V rally could unfold in the coming years.
So, the broader conclusion remains simple: THE LONG-TERM UPTREND MAY CONTINUE FOR YEARS TO COME.

Now, the Elliott Wave Projections
1) GOLD
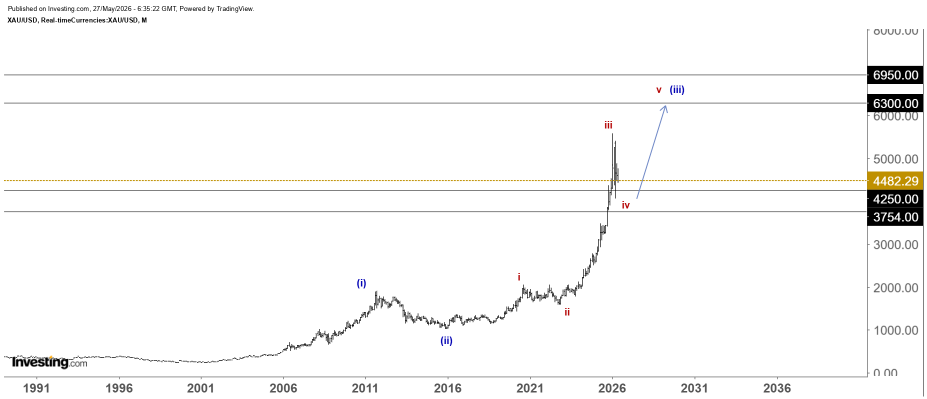
Assuming the correction has been completed around the $4,100 level, wave (v) of 3 could potentially advance toward the $6,300–$6,950 zone to complete the larger Wave 3 structure.
In our previous chart, the $6,100 level was identified as the probable target zone for Wave 3. Based on the latest price structure, this projection has now been slightly revised upward. However, the broader long-term view remains unchanged.
If the price declines toward our lower support zone around $3,750, then there could be a possible adjustment of approximately $200–$250 in our projected target zone of $6,300–$6,950.
Even at this stage, we can estimate where the larger Wave IV correction may develop and what the long-term expectations for Wave V could be. However, once we get a clearer confirmation of the completion of Wave III, our primary focus will shift toward analyzing the larger Wave IV correction and the potential targets for Wave V.
Here is the possible GOLD chart (Expected)
2) SILVER
Assuming the correction has ended at the $61 level, wave (v) of 3 could move toward the $128–$130 zone to complete wave 3. The $128 zone is a very important resistance area and only a strong breakout with momentum can open the possibility for the next target around $145. So, as of now, the expectation is for wave 3 to end near the $128 zone.
NOTE: All these levels are projected based on the assumption that the corrections in gold and silver are already complete. However, if the price makes a new low below the mentioned low or the second support level, these projected levels may need to be revised accordingly.
Here is the possible SILVER chart (Expected)
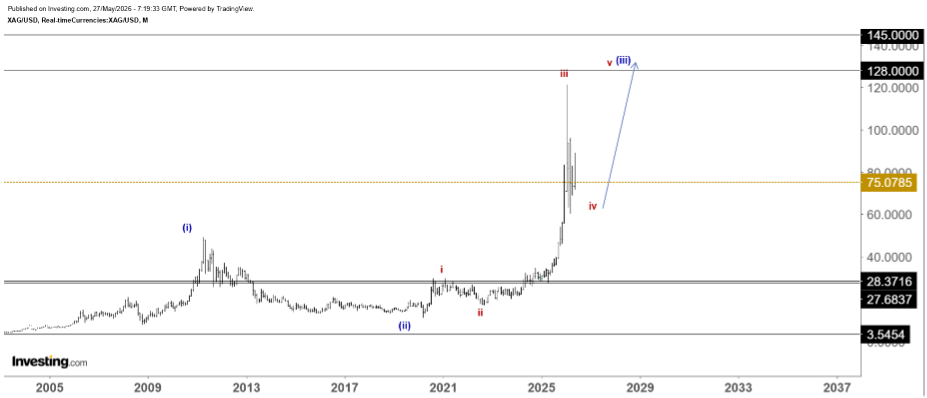
Important Note - Identifying the end of wave 3 is very difficult because wave 3 often has the nature of extending into multiple legs. Therefore, if any further extension occurs, these projected levels may be revised to even higher levels.
So the understanding here is, these PROJECTIONS ARE MINIMUM LEVELS TO END THE WAVE 3.

✨Learn the PUREST FORM OF ELLIOTT WAVE TRADING✨
🎯Learners across 12+ Countries with complete 5 star rated most practical course
Register to identify precise turning points, market reversals and clear targets with clarity. You can learn through my Elliott Wave course — WAVES LEADS THE PRICE.
👉Important Note: Make note of the Package Discount Coupon Code at the Checkout Page
🔗Course Links:
Elliott Wave Course - Waves Leads the Price
https://www.magicfibs.com/courses/Waves-Leads-The-Price-From-Magic%20Fibs-65e54218ce6d877f516ed105
PACKAGE - Elliott wave and Technical Analysis (with additional DISCOUNT)
https://www.magicfibs.com/courses/Technical-Analysis-Waves-Leads-The-Price-68205bdb78c5c22adf8916f3
Elliott Wave Course - Waves Leads the Price (TAMIL)
DISCLAIMER - I am not a SEBI-registered analyst or investment advisor. I do not provide any buy, sell, or investment recommendations, either directly or indirectly. All charts, market analysis, educational content, teachings, doubt-solving sessions, emails, and related communications are intended strictly for educational and learning purposes only. Any information shared should not be considered financial, investment, or trading advice. Users are advised to consult their own financial advisor before making any investment or trading decisions.

Arunkumar
Magic Fibs ®