There are no items in your cart
Add More
Add More
| Item Details | Price | ||
|---|---|---|---|


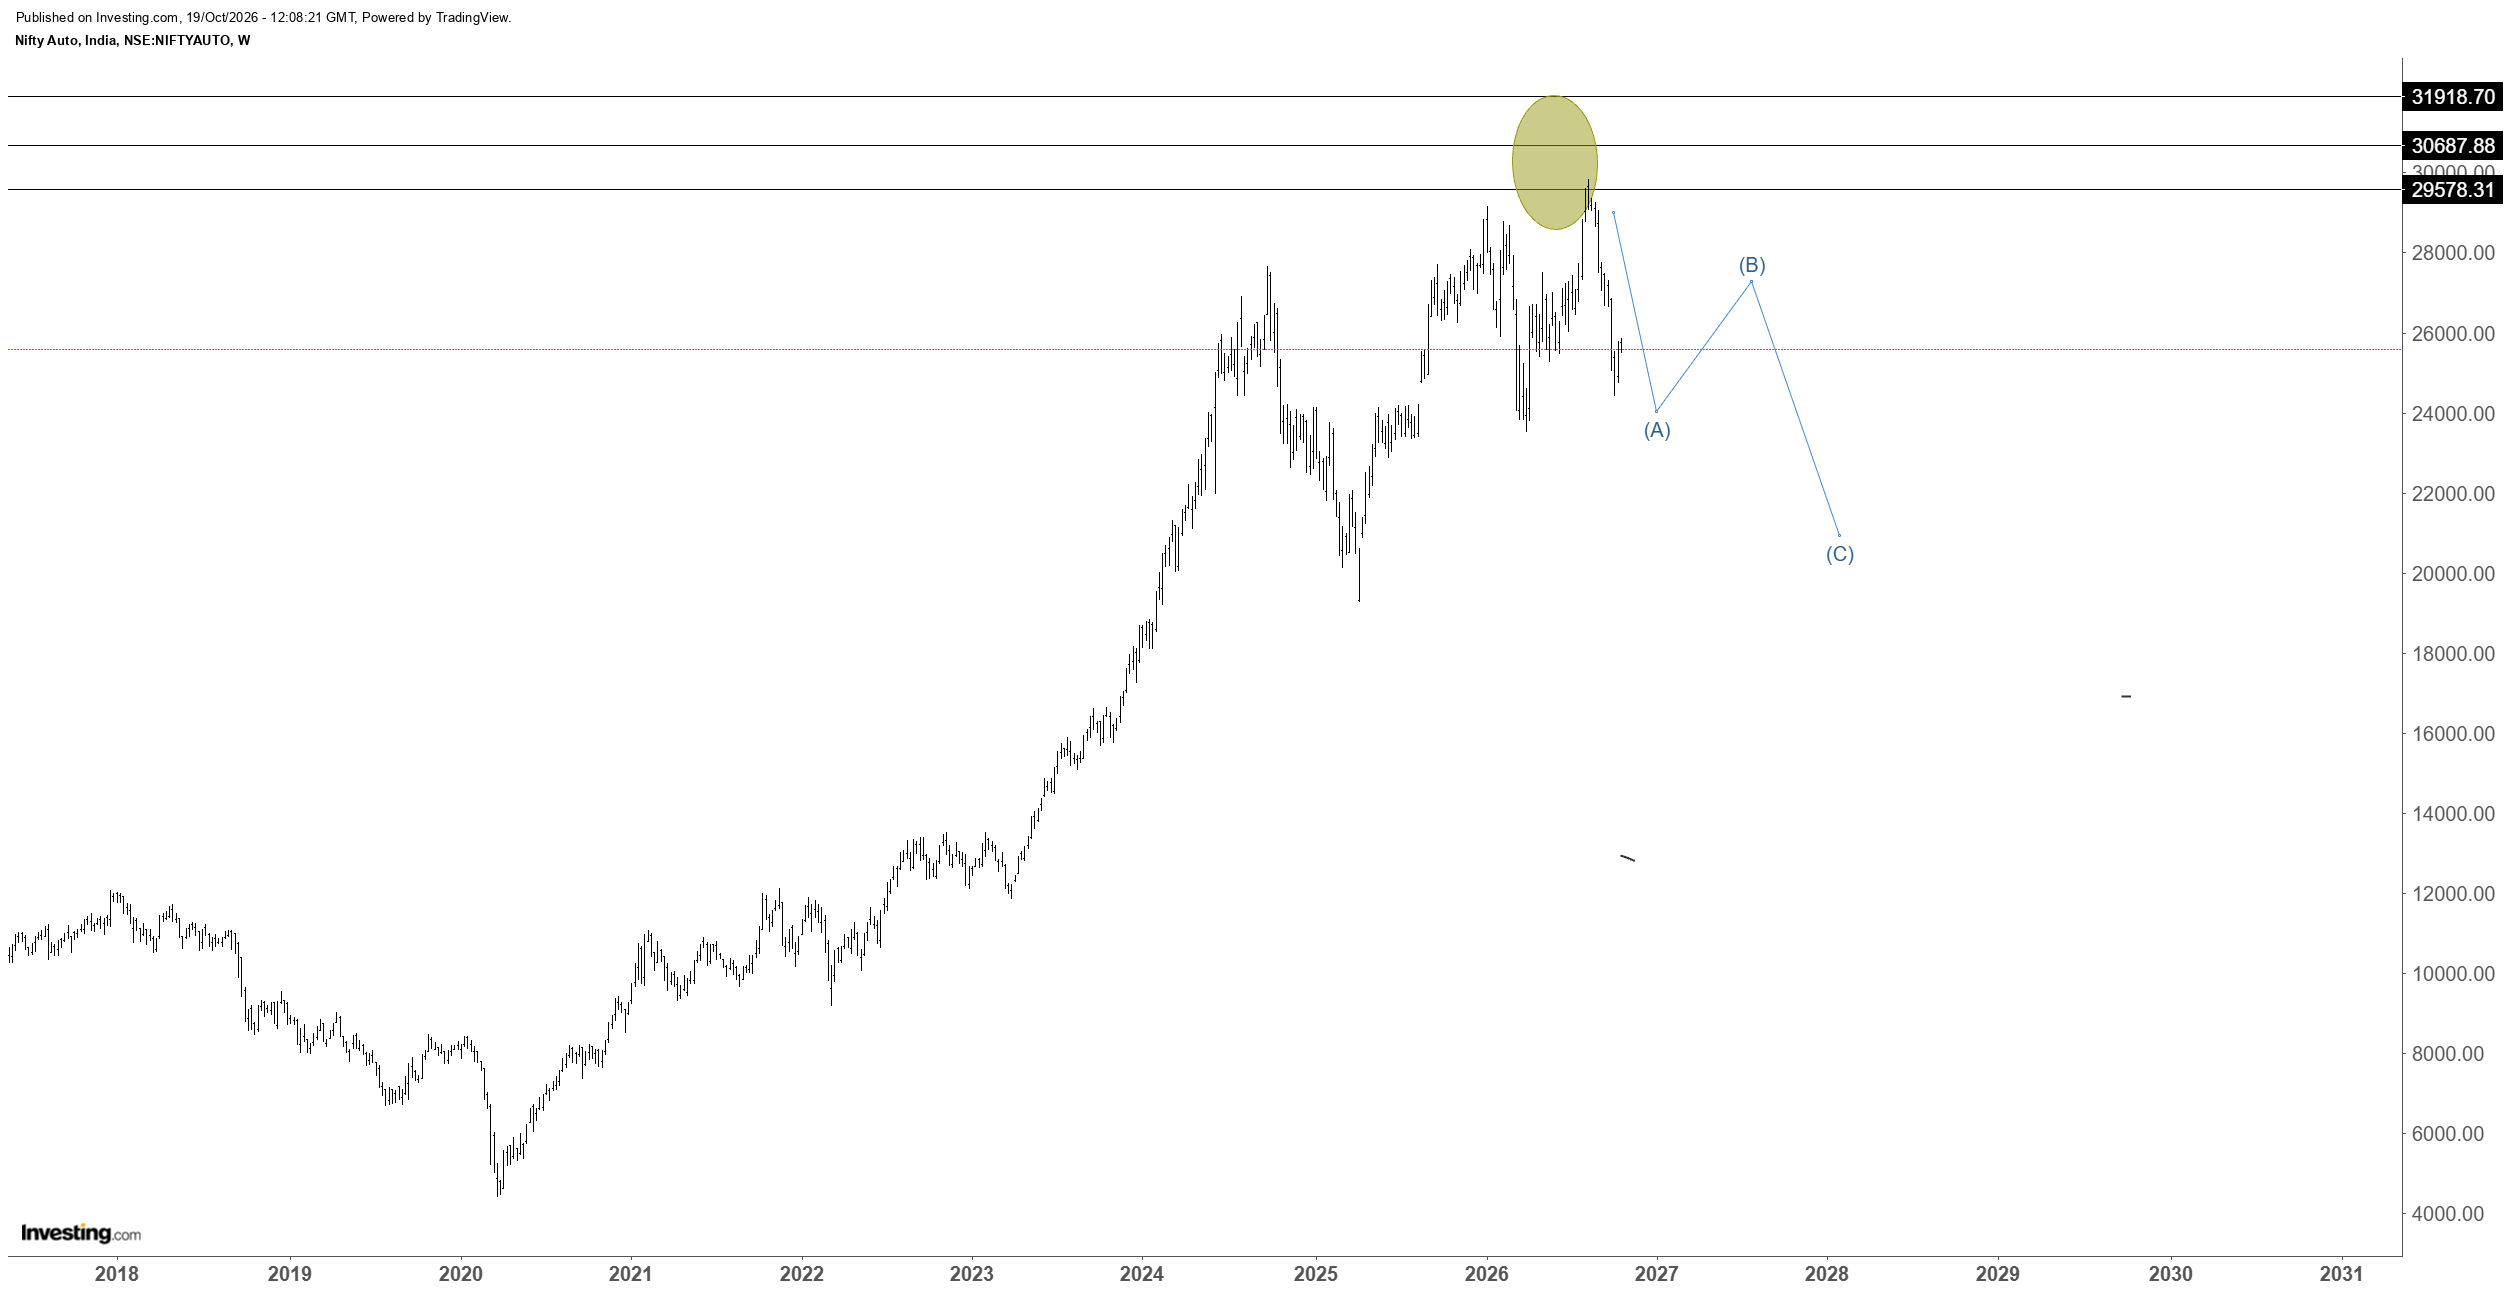
The Auto sector has declined almost 18% from its recent high, with the correction beginning in August 2026. But we were prepared for this correction well in advance, in February 2026 itself.
19/10/2026
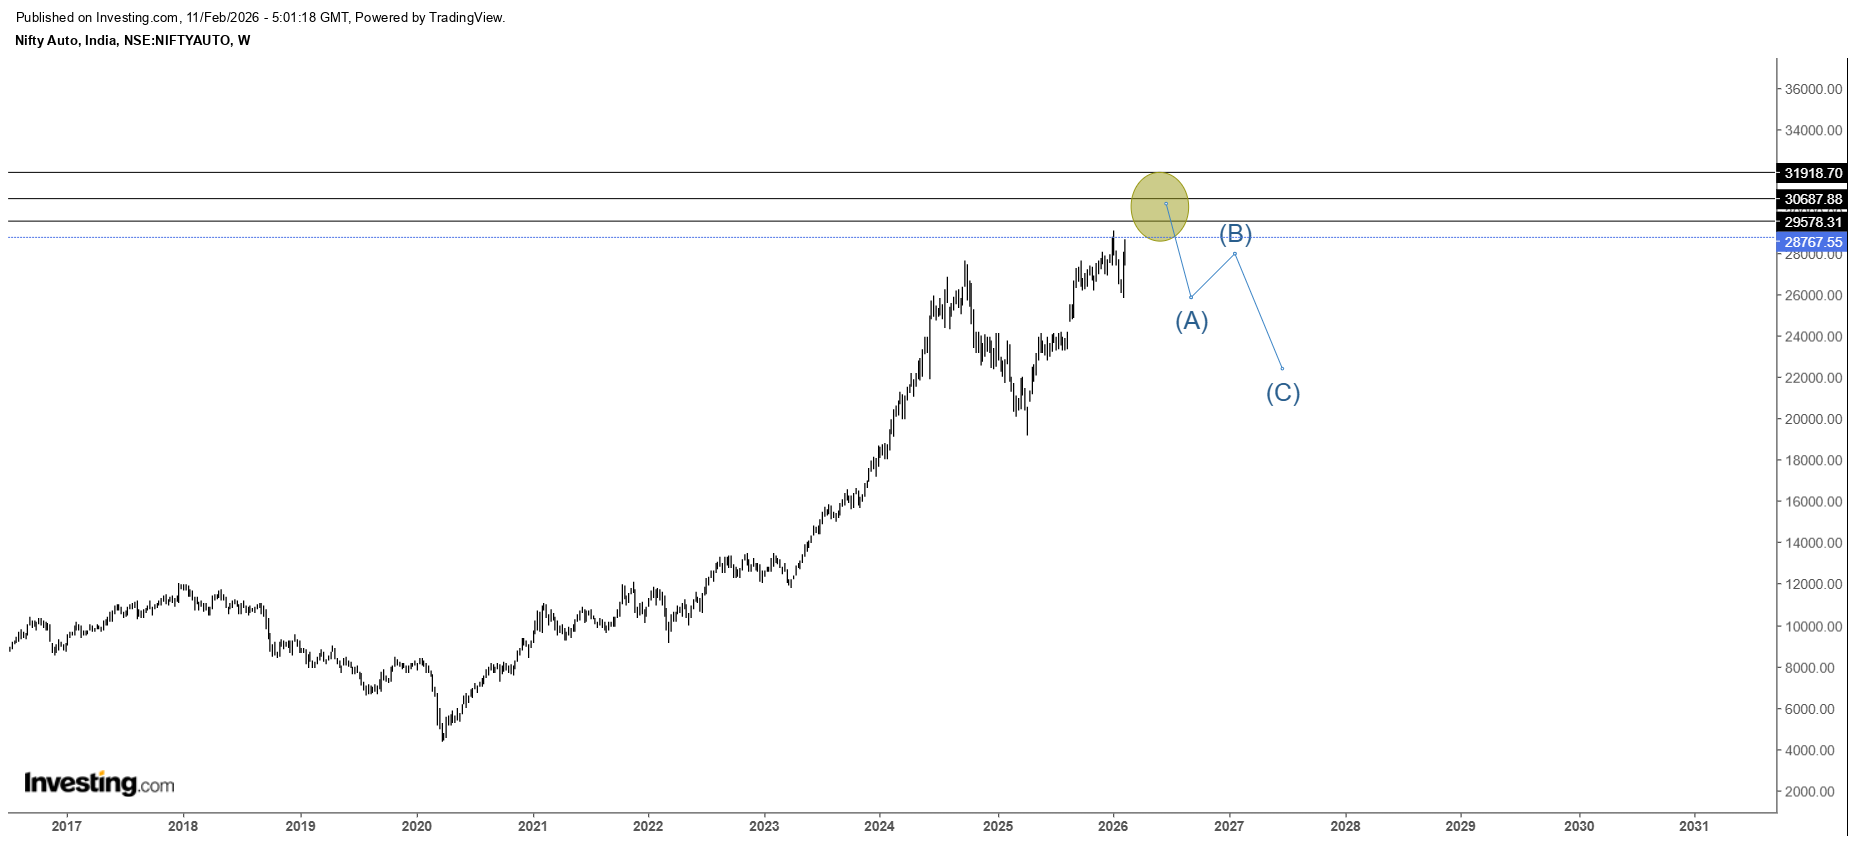
At that time, our analysis indicated that the Auto sector was approaching a potential top. We also identified the resistance zone where the price could face selling pressure and projected a key resistance level starting from 29,578
Below is the chart I shared in February 2026, highlighting the potential resistance zone and the possibility of a correction.
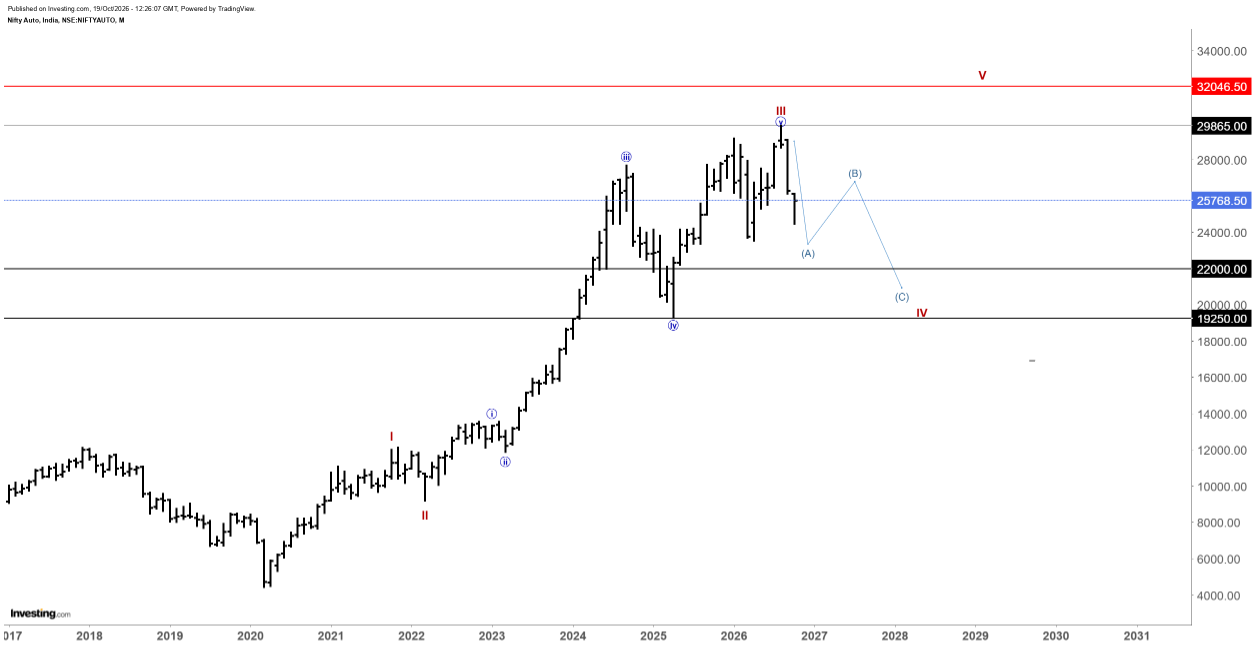
Below is the today’s chart (19.10.2026), where the prices faced the rejection at 29,865 and declined to 24,500 levels which is around 18%.
This is called preparedness and Elliott Wave analysis helped us anticipate not just the potential correction, but also the zone where the top could form.
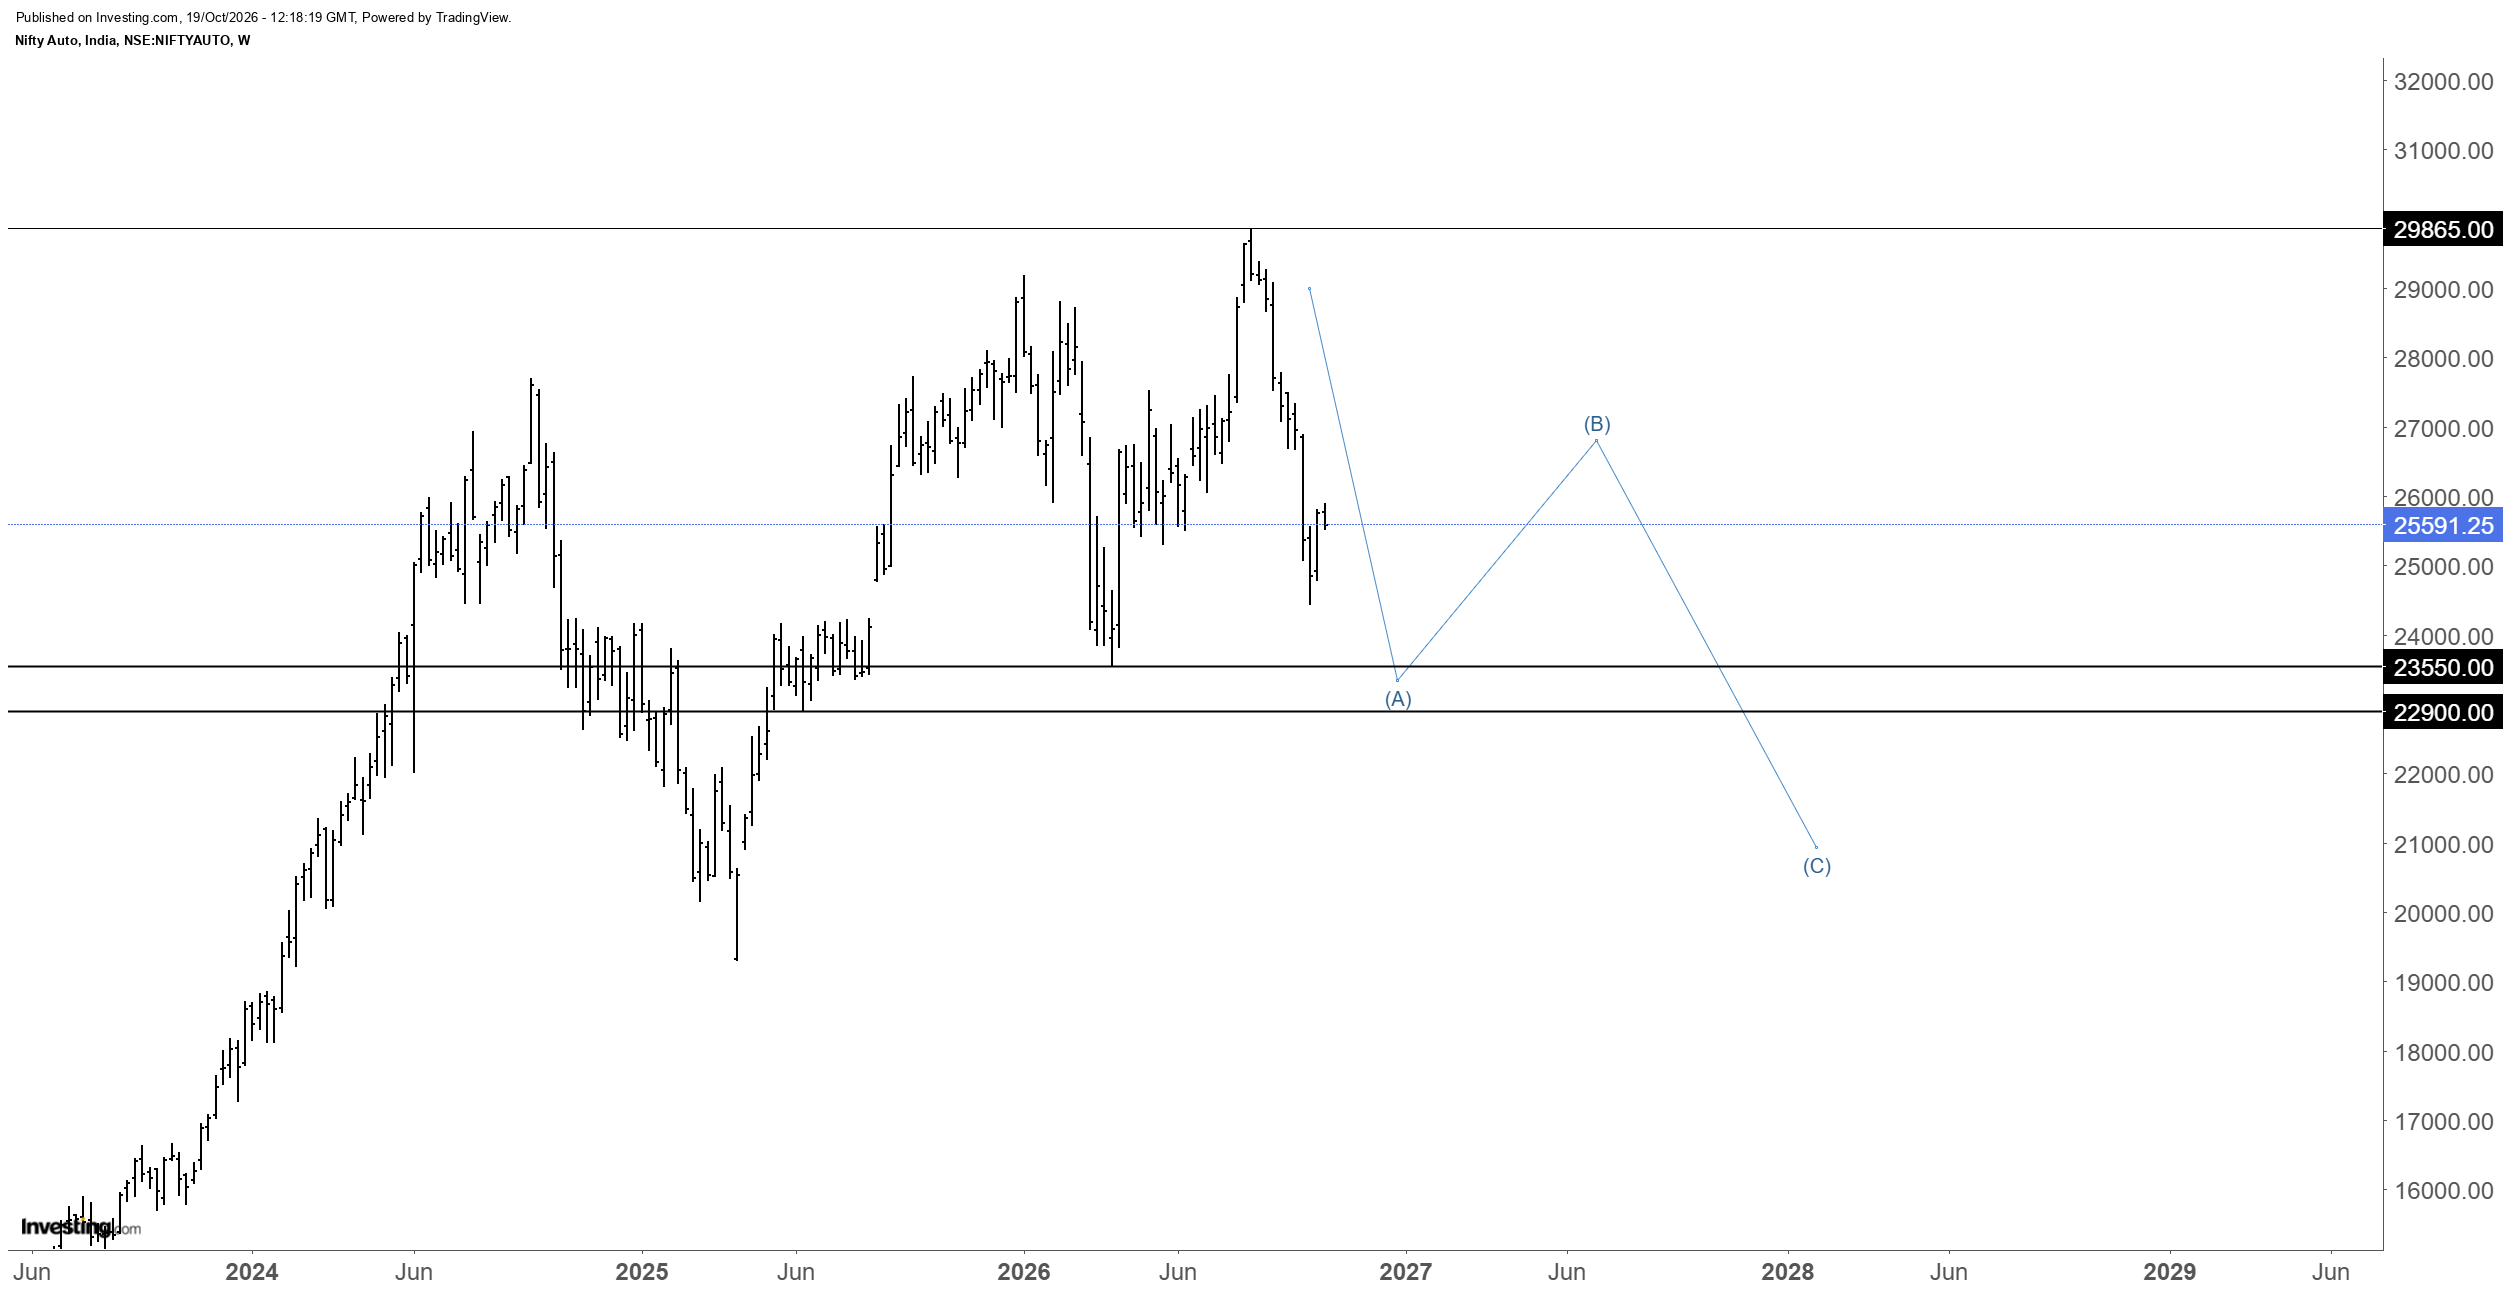
Although the Auto sector has corrected nearly 18% so far, our Elliott Wave analysis suggests that this could be only the first leg of the larger correction, labelled as Wave A. Waves B and C could unfold over the coming weeks or months, potentially extending the corrective phase further.

Possible end of Wave A
This first leg of decline can end between 23,550 to 22,900
Where Could Wave C End? What Is the Potential Bottom of This Correction?
After the completion of Wave B, the final leg, Wave C, could extend towards the 22,000–19,250 zone. This is a broader target range because we cannot determine the exact endpoint of Wave C until Wave B develops and completes.
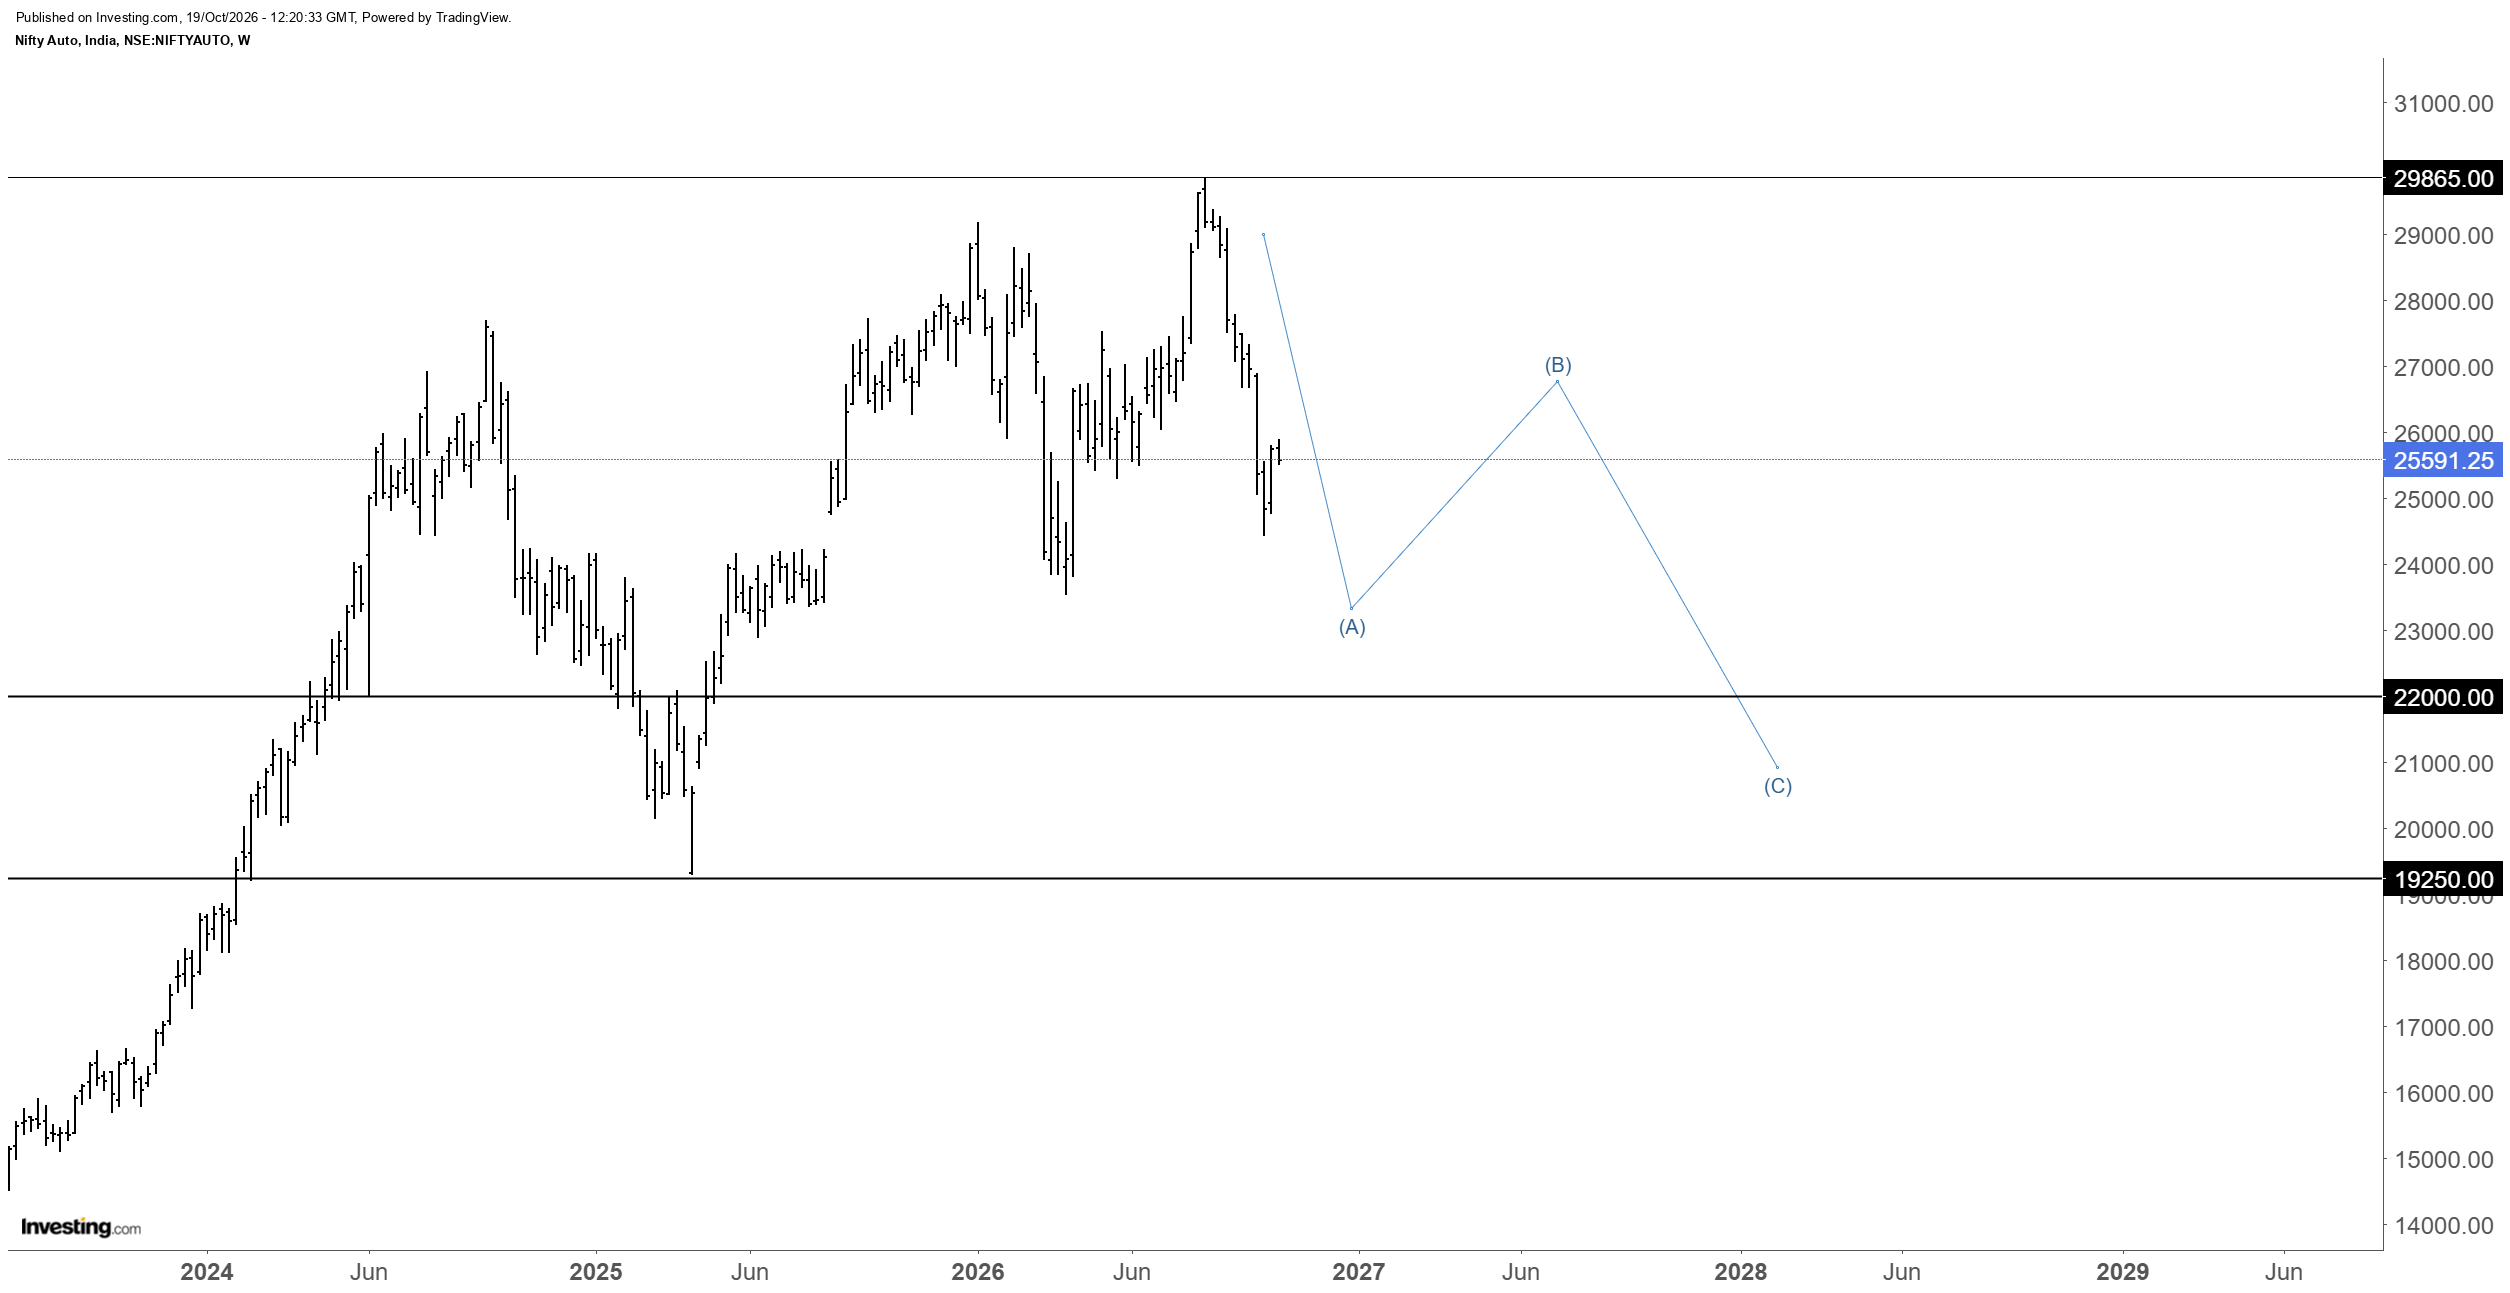
As the corrective structure unfolds, we can refine our analysis and identify more significant support levels and potential reversal zones.
Note – For now, I assume, this correction could develop as a simple correction, that is, a Zig Zag. If any pattern changes, the projected price levels and the time required for the correction may change accordingly.

Higher Time Frame Wave Count
On the monthly chart, the ongoing correction could be Wave 4 of the larger-degree Elliott Wave structure. If this count holds, a potential Wave 5 advance could follow after Wave 4 completes.
The completion of this correction will therefore be important in determining the next major move in the Auto sector. We will continue to monitor the developing wave structure to identify a potential bottom and assess the possibility of the next upward move.
You can follow me on X or subscribe to my YouTube channel for regular market updates.
👉You Tube - https://www.youtube.com/@magicfibs


Arunkumar
Magic Fibs ®